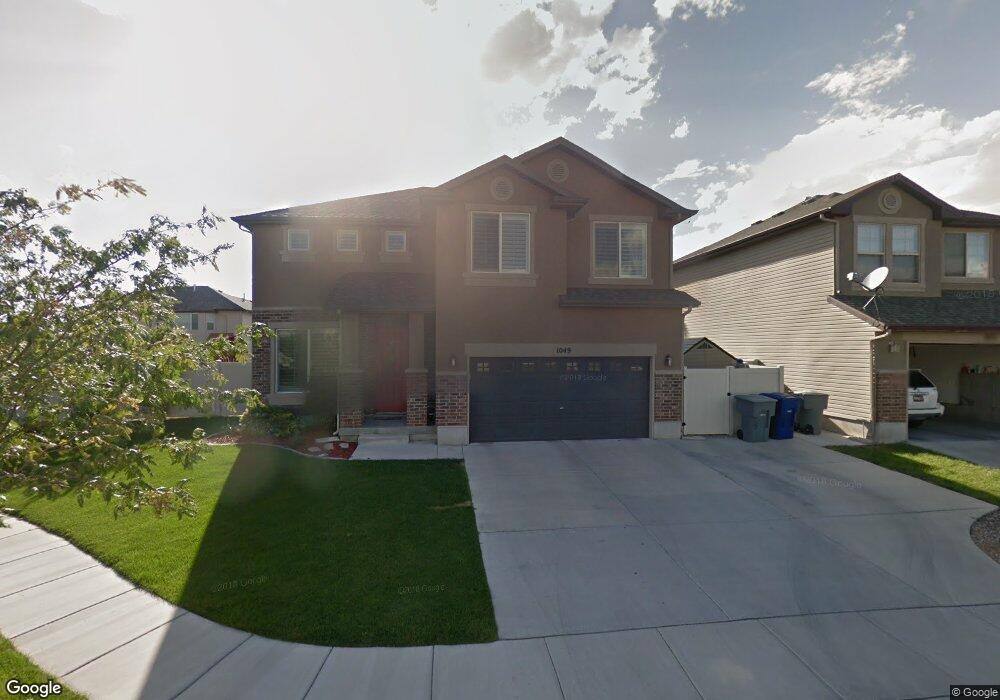
1049 Bellingham Ct North Salt Lake, UT 84054
Estimated Value: $538,000 - $619,000
4
Beds
3
Baths
2,236
Sq Ft
$260/Sq Ft
Est. Value
About This Home
This home is located at 1049 Bellingham Ct, North Salt Lake, UT 84054 and is currently estimated at $582,286, approximately $260 per square foot. 1049 Bellingham Ct is a home located in Davis County with nearby schools including Foxboro School, Mueller Park Junior High School, and Bountiful High School.
Ownership History
Date
Name
Owned For
Owner Type
Purchase Details
Closed on
Oct 3, 2012
Sold by
Carter Gary and Carter Stephanie
Bought by
Orton Evan and Orton Melissa
Current Estimated Value
Home Financials for this Owner
Home Financials are based on the most recent Mortgage that was taken out on this home.
Original Mortgage
$235,653
Outstanding Balance
$163,523
Interest Rate
3.63%
Mortgage Type
FHA
Estimated Equity
$418,763
Purchase Details
Closed on
Sep 6, 2007
Sold by
Woodside Cambria Llc
Bought by
Carter Gary and Carter Stephanie
Home Financials for this Owner
Home Financials are based on the most recent Mortgage that was taken out on this home.
Original Mortgage
$208,143
Interest Rate
6.57%
Mortgage Type
Purchase Money Mortgage
Purchase Details
Closed on
Dec 8, 2006
Sold by
Portola Development Utah Lc
Bought by
Woodside Cambria Llc
Create a Home Valuation Report for This Property
The Home Valuation Report is an in-depth analysis detailing your home's value as well as a comparison with similar homes in the area
Home Values in the Area
Average Home Value in this Area
Purchase History
| Date | Buyer | Sale Price | Title Company |
|---|---|---|---|
| Orton Evan | -- | Gt Title Services Salt | |
| Carter Gary | -- | Us Title Company Of Utah | |
| Woodside Cambria Llc | -- | None Available |
Source: Public Records
Mortgage History
| Date | Status | Borrower | Loan Amount |
|---|---|---|---|
| Open | Orton Evan | $235,653 | |
| Previous Owner | Carter Gary | $208,143 |
Source: Public Records
Tax History Compared to Growth
Tax History
| Year | Tax Paid | Tax Assessment Tax Assessment Total Assessment is a certain percentage of the fair market value that is determined by local assessors to be the total taxable value of land and additions on the property. | Land | Improvement |
|---|---|---|---|---|
| 2025 | $2,909 | $301,950 | $108,150 | $193,800 |
| 2024 | $2,909 | $292,601 | $114,604 | $177,997 |
| 2023 | $2,733 | $497,000 | $151,215 | $345,785 |
| 2022 | $2,854 | $284,900 | $65,756 | $219,144 |
| 2021 | $2,548 | $386,000 | $96,802 | $289,198 |
| 2020 | $2,269 | $340,000 | $82,398 | $257,602 |
| 2019 | $2,279 | $333,000 | $63,649 | $269,351 |
| 2018 | $2,110 | $305,000 | $57,863 | $247,137 |
| 2016 | $1,920 | $147,565 | $31,825 | $115,740 |
| 2015 | $1,828 | $134,970 | $31,825 | $103,145 |
| 2014 | $1,736 | $130,705 | $31,825 | $98,880 |
| 2013 | -- | $112,994 | $29,741 | $83,253 |
Source: Public Records
Map
Nearby Homes
- 1052 Chidester Dr
- 997 N Fox Hollow Dr
- 1147 Ethnie Ct
- 1147 Abbotsford Dr
- 1074 Allington Dr
- 1072 W Stonehaven Dr
- 1022 Allington Dr
- 1150 Wiltshire Dr
- 1002 W Stonehaven Dr Unit 108
- 967 Amberly Dr
- 997 Amberly Dr
- 940 W Stonehaven Dr
- 920 W Stonehaven Dr
- 928 Amberly Dr
- 741 N Skipton Dr
- 942 N Abbey Dr
- 715 Leeds Ct
- 1127 W Haworth Dr
- 2304 S 2060 W
- Somerset B Plan at Clifton Place Townhomes
- 1053 Bellingham Ct
- 1037 Bellingham Ct
- 1042 Cambria Dr
- 1050 Cambria Dr
- 1034 Cambria Dr
- 1059 Bellingham Ct
- 1058 Cambria Dr
- 1025 Bellingham Ct
- 1052 Bellingham Ct
- 1026 Cambria Dr
- 1048 Bellingham Ct
- 1066 Cambria Dr
- 1066 Bellingham Ct
- 1036 Bellingham Ct
- 1024 Bellingham Ct
- 1077 Bellingham Ct
- 1072 Bellingham Ct
- 1074 Cambria Dr
- 1041 Cambria Dr
- 1049 Cambria Dr