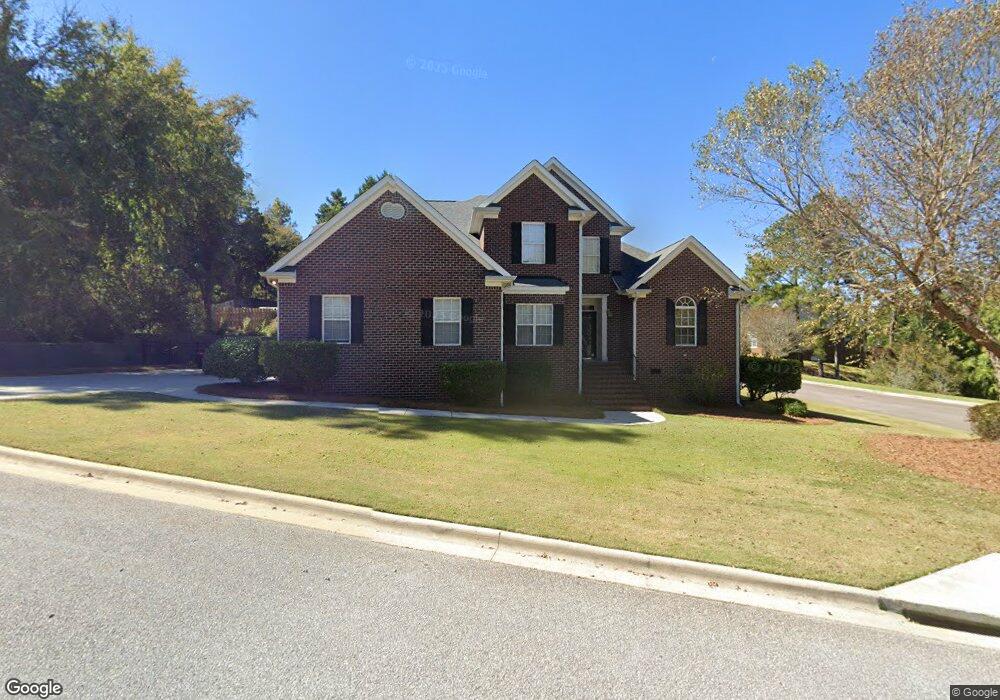
1049 Hampstead Place Augusta, GA 30907
Estimated Value: $382,000 - $407,000
4
Beds
4
Baths
2,341
Sq Ft
$167/Sq Ft
Est. Value
About This Home
This home is located at 1049 Hampstead Place, Augusta, GA 30907 and is currently estimated at $391,881, approximately $167 per square foot. 1049 Hampstead Place is a home located in Columbia County with nearby schools including Northmore Elementary School, Stevens Creek Elementary School, and Stallings Island Middle School.
Ownership History
Date
Name
Owned For
Owner Type
Purchase Details
Closed on
Dec 29, 2003
Sold by
Starnes E Thomas
Bought by
Starnes Traci
Current Estimated Value
Home Financials for this Owner
Home Financials are based on the most recent Mortgage that was taken out on this home.
Original Mortgage
$204,000
Interest Rate
5.82%
Mortgage Type
New Conventional
Purchase Details
Closed on
Dec 22, 2003
Sold by
Starnes Traci
Bought by
Starnes E Thomas
Home Financials for this Owner
Home Financials are based on the most recent Mortgage that was taken out on this home.
Original Mortgage
$204,000
Interest Rate
5.82%
Mortgage Type
New Conventional
Purchase Details
Closed on
Sep 25, 2001
Sold by
Starnes E Thomas
Bought by
Starnes Traci M
Home Financials for this Owner
Home Financials are based on the most recent Mortgage that was taken out on this home.
Original Mortgage
$195,000
Interest Rate
6.45%
Mortgage Type
Purchase Money Mortgage
Create a Home Valuation Report for This Property
The Home Valuation Report is an in-depth analysis detailing your home's value as well as a comparison with similar homes in the area
Home Values in the Area
Average Home Value in this Area
Purchase History
| Date | Buyer | Sale Price | Title Company |
|---|---|---|---|
| Starnes Traci | -- | -- | |
| Starnes E Thomas | -- | -- | |
| Starnes Traci M | -- | -- |
Source: Public Records
Mortgage History
| Date | Status | Borrower | Loan Amount |
|---|---|---|---|
| Closed | Starnes E Thomas | $204,000 | |
| Closed | Starnes Traci M | $195,000 |
Source: Public Records
Tax History Compared to Growth
Tax History
| Year | Tax Paid | Tax Assessment Tax Assessment Total Assessment is a certain percentage of the fair market value that is determined by local assessors to be the total taxable value of land and additions on the property. | Land | Improvement |
|---|---|---|---|---|
| 2025 | $3,774 | $157,790 | $28,004 | $129,786 |
| 2024 | $3,431 | $136,936 | $26,504 | $110,432 |
| 2023 | $3,431 | $111,456 | $20,804 | $90,652 |
| 2022 | $3,020 | $115,932 | $22,004 | $93,928 |
| 2021 | $2,947 | $108,208 | $18,804 | $89,404 |
| 2020 | $2,729 | $98,121 | $18,504 | $79,617 |
| 2019 | $2,670 | $96,004 | $18,004 | $78,000 |
| 2018 | $2,773 | $99,354 | $17,504 | $81,850 |
| 2017 | $2,565 | $91,591 | $17,004 | $74,587 |
| 2016 | $2,551 | $94,472 | $16,580 | $77,892 |
| 2015 | $2,353 | $86,943 | $15,880 | $71,063 |
| 2014 | $2,335 | $85,226 | $16,680 | $68,546 |
Source: Public Records
Map
Nearby Homes
- 1119 Hampstead Place
- 1094 Hampstead Place
- 2032 Pheasant Creek Dr
- 828 Mayo Ln
- 307 Old Salem Way
- 3555 Watervale Way
- 808 Oshields Ct
- 333 Old Salem Way
- 705 Cool Brook Ct
- 3244 Riverstone Dr
- 3503 Wakefield Ct
- 816 Brookfield Pkwy
- 2020 Autumn Chase
- 3038 Sterling Rd
- 408 Hastings Place
- 2044 Bridgewater Dr
- 820 Mitchell St
- 3593 Westhampton Dr
- 826 Mitchell St
- 271 Watervale Rd
- 1125 Hampstead Place
- 1051 Hampstead Place
- 1123 Hampstead Place
- 1048 Hampstead Place
- 1050 Hampstead Place
- 343 Heath Way
- 1046 Hampstead Place
- 1126 Hampstead Place
- 1052 Hampstead Place
- 1121 Hampstead Place
- 1044 Hampstead Place
- 345 Heath Way
- 1124 Hampstead Place
- 1056 Hampstead Place
- 1059 Hampstead Place
- 1122 Hampstead Place
- 3577 Granite Ct
- 347 Heath Way
- 1058 Hampstead Place
- 3579 Granite Ct