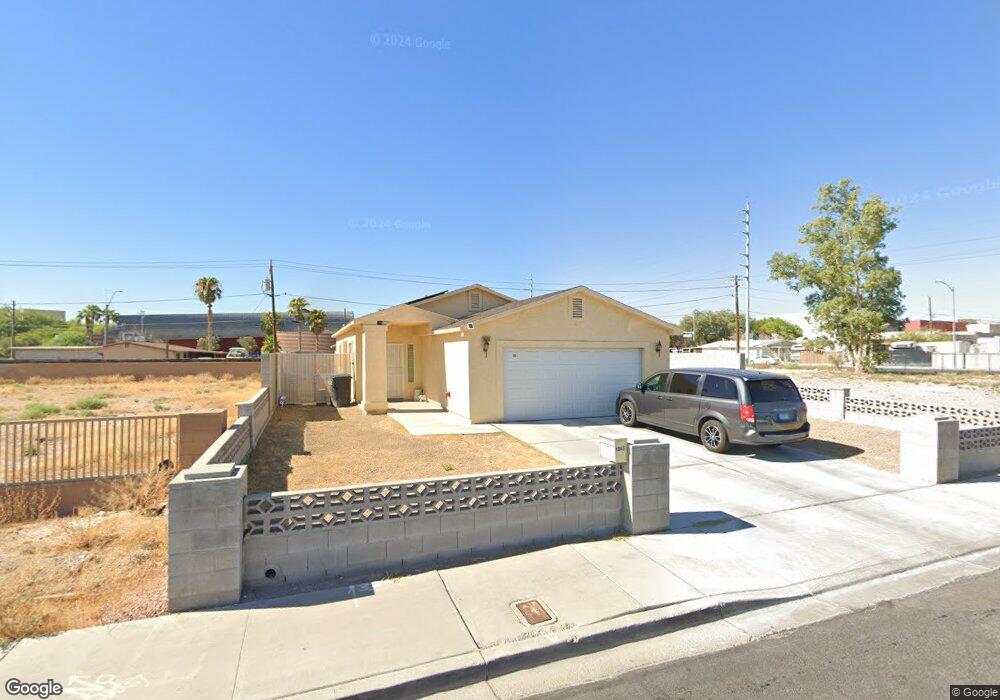
1049 Hart Ave Las Vegas, NV 89106
West Las Vegas NeighborhoodEstimated Value: $341,251 - $372,000
3
Beds
2
Baths
1,500
Sq Ft
$237/Sq Ft
Est. Value
About This Home
This home is located at 1049 Hart Ave, Las Vegas, NV 89106 and is currently estimated at $355,563, approximately $237 per square foot. 1049 Hart Ave is a home located in Clark County with nearby schools including H.P. Fitzgerald Elementary School, West Prepatory Academy At Charlles I West Hall Sec, and Canyon Springs High School And The Leadership And.
Ownership History
Date
Name
Owned For
Owner Type
Purchase Details
Closed on
Feb 9, 2006
Sold by
Jones Josie
Bought by
Jones Robert C
Current Estimated Value
Home Financials for this Owner
Home Financials are based on the most recent Mortgage that was taken out on this home.
Original Mortgage
$165,000
Outstanding Balance
$93,821
Interest Rate
6.37%
Mortgage Type
Purchase Money Mortgage
Estimated Equity
$261,742
Purchase Details
Closed on
Nov 6, 2003
Sold by
Schlageter Joseph C and Schlageter Rita M
Bought by
Lindsey Scottie
Home Financials for this Owner
Home Financials are based on the most recent Mortgage that was taken out on this home.
Original Mortgage
$24,000
Interest Rate
6%
Mortgage Type
Seller Take Back
Purchase Details
Closed on
Mar 25, 2003
Sold by
Mccain Douglas
Bought by
Armstrong Sammie
Purchase Details
Closed on
Mar 19, 2003
Sold by
Big Mc Inc
Bought by
Schlageter Joseph C and Schlageter Rita M
Purchase Details
Closed on
Jun 25, 1994
Sold by
Mccain Douglas Ray
Bought by
Big Mc Inc
Create a Home Valuation Report for This Property
The Home Valuation Report is an in-depth analysis detailing your home's value as well as a comparison with similar homes in the area
Home Values in the Area
Average Home Value in this Area
Purchase History
| Date | Buyer | Sale Price | Title Company |
|---|---|---|---|
| Jones Robert C | -- | Lawyers Title Of Nevada | |
| Jones Robert C | $240,000 | Lawyers Title Of Nevada | |
| Lindsey Scottie | $25,000 | Ticor Title Of Nevada Inc | |
| Armstrong Sammie | $18,750 | -- | |
| Schlageter Joseph C | $16,000 | Pioneer National Title | |
| Big Mc Inc | -- | -- |
Source: Public Records
Mortgage History
| Date | Status | Borrower | Loan Amount |
|---|---|---|---|
| Open | Jones Robert C | $165,000 | |
| Previous Owner | Lindsey Scottie | $24,000 |
Source: Public Records
Tax History Compared to Growth
Tax History
| Year | Tax Paid | Tax Assessment Tax Assessment Total Assessment is a certain percentage of the fair market value that is determined by local assessors to be the total taxable value of land and additions on the property. | Land | Improvement |
|---|---|---|---|---|
| 2025 | $1,111 | $77,583 | $13,125 | $64,458 |
| 2024 | $1,080 | $77,583 | $13,125 | $64,458 |
| 2023 | $881 | $73,621 | $13,125 | $60,496 |
| 2022 | $1,048 | $68,130 | $13,005 | $55,125 |
| 2021 | $1,018 | $62,190 | $9,844 | $52,346 |
| 2020 | $985 | $61,691 | $9,844 | $51,847 |
| 2019 | $956 | $58,701 | $7,656 | $51,045 |
| 2018 | $929 | $56,249 | $7,438 | $48,811 |
| 2017 | $1,829 | $55,804 | $6,563 | $49,241 |
| 2016 | $881 | $34,238 | $4,200 | $30,038 |
| 2015 | $878 | $32,246 | $2,625 | $29,621 |
| 2014 | $850 | $42,688 | $2,625 | $40,063 |
Source: Public Records
Map
Nearby Homes
- 1030 W Lake Mead Blvd
- 1249 Hassell Ave
- 832 Hart Ave
- 1972 H St
- 1316 Lawry Ave
- 1212 Eleanor Ave
- 952 Balzar Ave
- 1212 Balzar Ave
- 844 Balzar Ave
- 2130 Revere St
- 1328 Balzar Ave
- 729 van Ert Ave
- 616 Bowman Ave
- 2222 N Martin l King Blvd
- 1648 J St
- 700 van Ert Ave
- 2100 Fred Brown Dr
- 1641 K St
- 1636 J St
- 525 Byrnes Ave
- 1037 Hart Ave
- 1061 Hart Ave
- 1061 Hart Ave Unit 1
- 1025 Hart Ave
- 1036 W Lake Mead Blvd
- 2042 Concord St
- 1072 W Lake Mead Blvd
- 1001 Hart Ave
- 1084 W Lake Mead Blvd
- 1036 Hart Ave
- 1060 Hart Ave
- 1024 Hart Ave
- 1088 Hart Ave
- 1012 Hart Ave
- 1117 Hart Ave
- 988 Hart Ave
- 1116 W Lake Mead Blvd
- 976 Hart Ave
- 1141 Hart Ave
- 1128 W Lake Mead Blvd