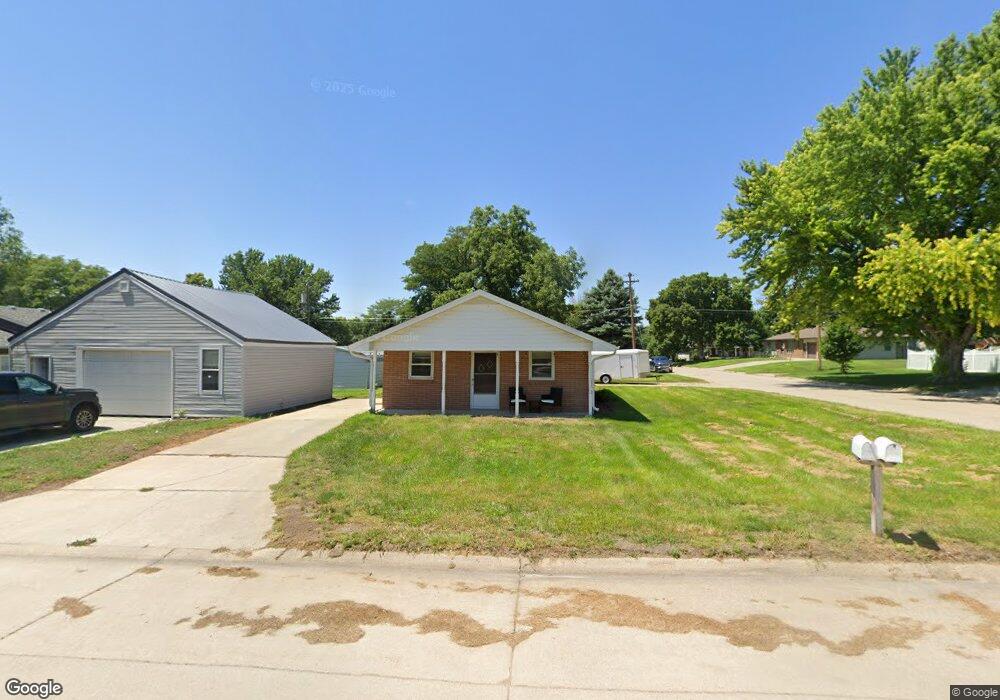
1049 N 14th Ave Broken Bow, NE 68822
Estimated Value: $125,476 - $183,000
--
Bed
1
Bath
816
Sq Ft
$193/Sq Ft
Est. Value
About This Home
This home is located at 1049 N 14th Ave, Broken Bow, NE 68822 and is currently estimated at $157,869, approximately $193 per square foot. 1049 N 14th Ave is a home located in Custer County with nearby schools including North Park Elementary School, Broken Bow Junior High School, and Broken Bow High School.
Ownership History
Date
Name
Owned For
Owner Type
Purchase Details
Closed on
Jun 23, 2020
Sold by
Reimers Kara L
Bought by
Coufal Keithan J
Current Estimated Value
Purchase Details
Closed on
Jul 8, 2013
Sold by
Walker Jace J
Bought by
Hansen Travis N and Hansen Jyll R
Purchase Details
Closed on
Jun 9, 2010
Sold by
Flynn Travin
Bought by
Walker Jace J
Purchase Details
Closed on
Feb 15, 2008
Sold by
Deutsche Bank National Tr Co
Bought by
Flynn Travin
Purchase Details
Closed on
Dec 21, 2006
Sold by
Nozicka Clifford E
Bought by
Deutsche Bank National Tr Co
Create a Home Valuation Report for This Property
The Home Valuation Report is an in-depth analysis detailing your home's value as well as a comparison with similar homes in the area
Home Values in the Area
Average Home Value in this Area
Purchase History
| Date | Buyer | Sale Price | Title Company |
|---|---|---|---|
| Coufal Keithan J | $83,500 | -- | |
| Hansen Travis N | $58,000 | -- | |
| Walker Jace J | $54,900 | -- | |
| Flynn Travin | $24,000 | -- | |
| Deutsche Bank National Tr Co | $37,800 | -- |
Source: Public Records
Tax History Compared to Growth
Tax History
| Year | Tax Paid | Tax Assessment Tax Assessment Total Assessment is a certain percentage of the fair market value that is determined by local assessors to be the total taxable value of land and additions on the property. | Land | Improvement |
|---|---|---|---|---|
| 2025 | $1,268 | $108,976 | $8,979 | $99,997 |
| 2024 | $1,268 | $94,477 | $8,979 | $85,498 |
| 2023 | $1,520 | $97,004 | $8,979 | $88,025 |
| 2022 | $1,514 | $82,490 | $8,979 | $73,511 |
| 2021 | $1,470 | $81,929 | $8,418 | $73,511 |
| 2020 | $1,457 | $81,929 | $8,418 | $73,511 |
| 2019 | $1,327 | $74,719 | $4,209 | $70,510 |
| 2017 | $1,076 | $58,897 | $4,209 | $54,688 |
| 2016 | $1,148 | $57,438 | $2,750 | $54,688 |
| 2015 | $1,167 | $57,897 | $2,717 | $55,180 |
| 2014 | $1,167 | $52,633 | $2,470 | $50,163 |
Source: Public Records
Map
Nearby Homes