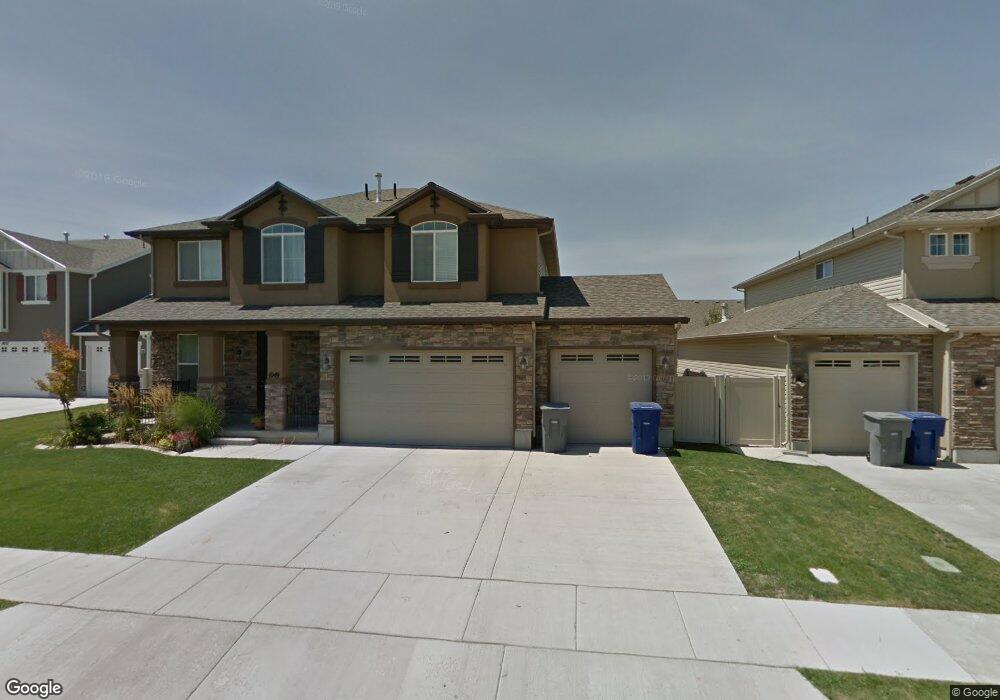
1049 Newham Ct North Salt Lake, UT 84054
Estimated Value: $612,000 - $637,000
5
Beds
3
Baths
2,543
Sq Ft
$246/Sq Ft
Est. Value
About This Home
This home is located at 1049 Newham Ct, North Salt Lake, UT 84054 and is currently estimated at $626,072, approximately $246 per square foot. 1049 Newham Ct is a home located in Davis County with nearby schools including Foxboro School, Mueller Park Junior High School, and Bountiful High School.
Ownership History
Date
Name
Owned For
Owner Type
Purchase Details
Closed on
Aug 11, 2017
Sold by
Burleson Amy L
Bought by
Breinholt Joshua S and Breinholt Ashley
Current Estimated Value
Home Financials for this Owner
Home Financials are based on the most recent Mortgage that was taken out on this home.
Original Mortgage
$310,500
Outstanding Balance
$258,960
Interest Rate
4.03%
Mortgage Type
New Conventional
Estimated Equity
$367,112
Purchase Details
Closed on
Jul 12, 2016
Sold by
Burleson Colby and Burleson Amy
Bought by
Burleson Amy I and Burleson Trust
Purchase Details
Closed on
Aug 11, 2008
Sold by
Woodside Amberly Llc
Bought by
Burleson Colby and Burleson Amy
Home Financials for this Owner
Home Financials are based on the most recent Mortgage that was taken out on this home.
Original Mortgage
$212,250
Interest Rate
6.37%
Mortgage Type
Purchase Money Mortgage
Create a Home Valuation Report for This Property
The Home Valuation Report is an in-depth analysis detailing your home's value as well as a comparison with similar homes in the area
Home Values in the Area
Average Home Value in this Area
Purchase History
| Date | Buyer | Sale Price | Title Company |
|---|---|---|---|
| Breinholt Joshua S | -- | Old Republic National Title | |
| Burleson Amy I | -- | -- | |
| Burleson Colby | -- | Us Title Company Of Utah |
Source: Public Records
Mortgage History
| Date | Status | Borrower | Loan Amount |
|---|---|---|---|
| Open | Breinholt Joshua S | $310,500 | |
| Previous Owner | Burleson Colby | $212,250 |
Source: Public Records
Tax History Compared to Growth
Tax History
| Year | Tax Paid | Tax Assessment Tax Assessment Total Assessment is a certain percentage of the fair market value that is determined by local assessors to be the total taxable value of land and additions on the property. | Land | Improvement |
|---|---|---|---|---|
| 2025 | $3,100 | $321,750 | $104,295 | $217,455 |
| 2024 | $3,100 | $311,850 | $109,760 | $202,090 |
| 2023 | $2,931 | $533,000 | $144,173 | $388,827 |
| 2022 | $3,063 | $305,800 | $62,734 | $243,066 |
| 2021 | $2,713 | $411,000 | $91,500 | $319,500 |
| 2020 | $2,416 | $362,000 | $77,944 | $284,056 |
| 2019 | $2,429 | $355,000 | $61,966 | $293,034 |
| 2018 | $2,276 | $329,000 | $56,333 | $272,667 |
| 2016 | $2,072 | $159,280 | $30,983 | $128,297 |
| 2015 | $1,975 | $145,860 | $30,983 | $114,877 |
| 2014 | $1,830 | $137,759 | $30,983 | $106,776 |
| 2013 | -- | $127,721 | $28,511 | $99,210 |
Source: Public Records
Map
Nearby Homes
- 1052 Chidester Dr
- 997 N Fox Hollow Dr
- 997 Amberly Dr
- 967 Amberly Dr
- 1150 Wiltshire Dr
- 1147 Abbotsford Dr
- 1022 Allington Dr
- 928 Amberly Dr
- 1002 W Stonehaven Dr Unit 108
- 942 N Abbey Dr
- 1074 Allington Dr
- 940 W Stonehaven Dr
- 920 W Stonehaven Dr
- 1072 W Stonehaven Dr
- 1147 Ethnie Ct
- Somerset B Plan at Clifton Place Townhomes
- Somerset A Plan at Clifton Place Townhomes
- Camden Plan at Clifton Place Townhomes
- Charleston Plan at Clifton Place Townhomes
- Kensington Plan at Clifton Place Townhomes