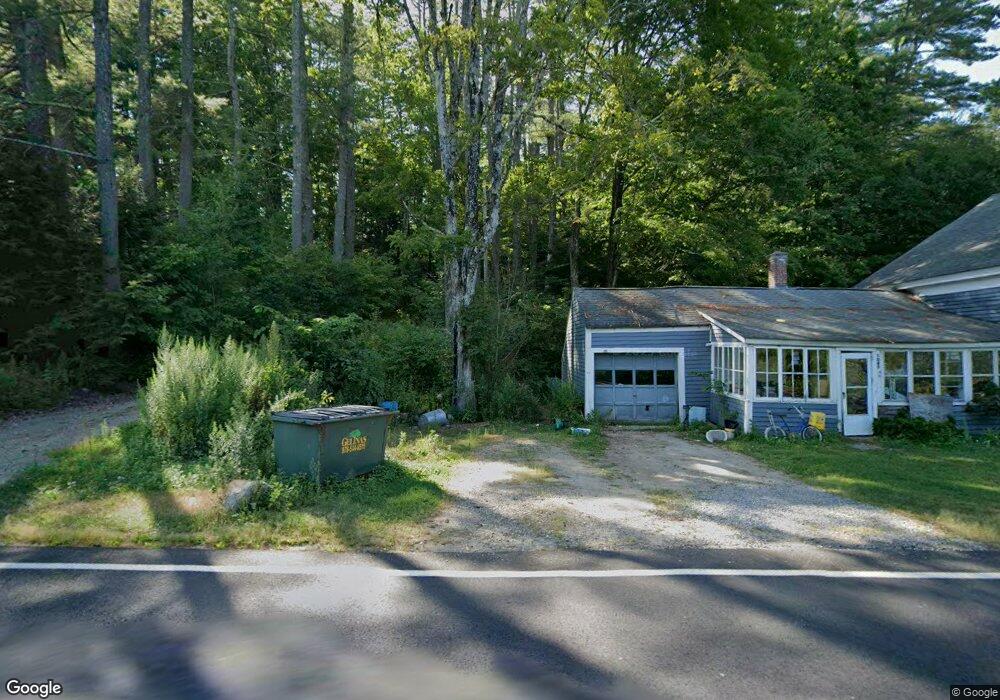
1049 Orange Rd Warwick, MA 01378
Warwick NeighborhoodEstimated Value: $528,000 - $640,768
3
Beds
3
Baths
3,658
Sq Ft
$164/Sq Ft
Est. Value
About This Home
This home is located at 1049 Orange Rd, Warwick, MA 01378 and is currently estimated at $600,923, approximately $164 per square foot. 1049 Orange Rd is a home located in Franklin County with nearby schools including Pioneer Valley Regional.
Ownership History
Date
Name
Owned For
Owner Type
Purchase Details
Closed on
Oct 29, 2025
Sold by
Engman Eric B
Bought by
Engman Eric B and Hirakis Amy L
Current Estimated Value
Purchase Details
Closed on
May 25, 2010
Sold by
Montgomery Cornelia
Bought by
Engman Eric B
Purchase Details
Closed on
Jun 1, 2009
Sold by
Engman John David Est and Montgomery
Bought by
Engman Eric B
Create a Home Valuation Report for This Property
The Home Valuation Report is an in-depth analysis detailing your home's value as well as a comparison with similar homes in the area
Home Values in the Area
Average Home Value in this Area
Purchase History
| Date | Buyer | Sale Price | Title Company |
|---|---|---|---|
| Engman Eric B | -- | -- | |
| Engman Eric B | -- | -- | |
| Engman Eric B | -- | -- | |
| Engman Eric B | -- | -- | |
| Engman Eric B | -- | -- |
Source: Public Records
Mortgage History
| Date | Status | Borrower | Loan Amount |
|---|---|---|---|
| Previous Owner | Engman Eric B | $50,000 |
Source: Public Records
Tax History
| Year | Tax Paid | Tax Assessment Tax Assessment Total Assessment is a certain percentage of the fair market value that is determined by local assessors to be the total taxable value of land and additions on the property. | Land | Improvement |
|---|---|---|---|---|
| 2025 | $9,580 | $538,800 | $41,800 | $497,000 |
| 2024 | $9,020 | $545,000 | $41,800 | $503,200 |
| 2023 | $7,771 | $386,400 | $41,800 | $344,600 |
| 2022 | $8,274 | $392,700 | $42,300 | $350,400 |
| 2021 | $7,059 | $359,600 | $38,000 | $321,600 |
| 2020 | $7,140 | $350,500 | $37,800 | $312,700 |
| 2019 | $6,958 | $327,600 | $37,800 | $289,800 |
| 2018 | $7,089 | $327,600 | $37,800 | $289,800 |
| 2017 | $6,588 | $327,600 | $37,800 | $289,800 |
| 2016 | $6,706 | $327,600 | $37,800 | $289,800 |
| 2015 | $7,195 | $361,200 | $44,500 | $316,700 |
Source: Public Records
Map
Nearby Homes
- 56 Shelter St
- 30 Cottage St
- 44 Moss Brook Rd
- 166-168 W Main St
- 49 Lincoln Ave
- 36 Summit St Unit A
- 36 Summit St Unit B
- 83 W Main St
- 222 W River St
- 12-14 E Main St
- 30 Stone Valley Rd
- 50 E Main St
- 58 E Main St
- 67 Putnam St
- 150 E Main St
- 216 Holtshire Rd
- 313-315 Walnut Hill Rd
- 270 S Main St
- 246 Holtshire Rd Unit Lot 3
- 490 S Main St
Your Personal Tour Guide
Ask me questions while you tour the home.