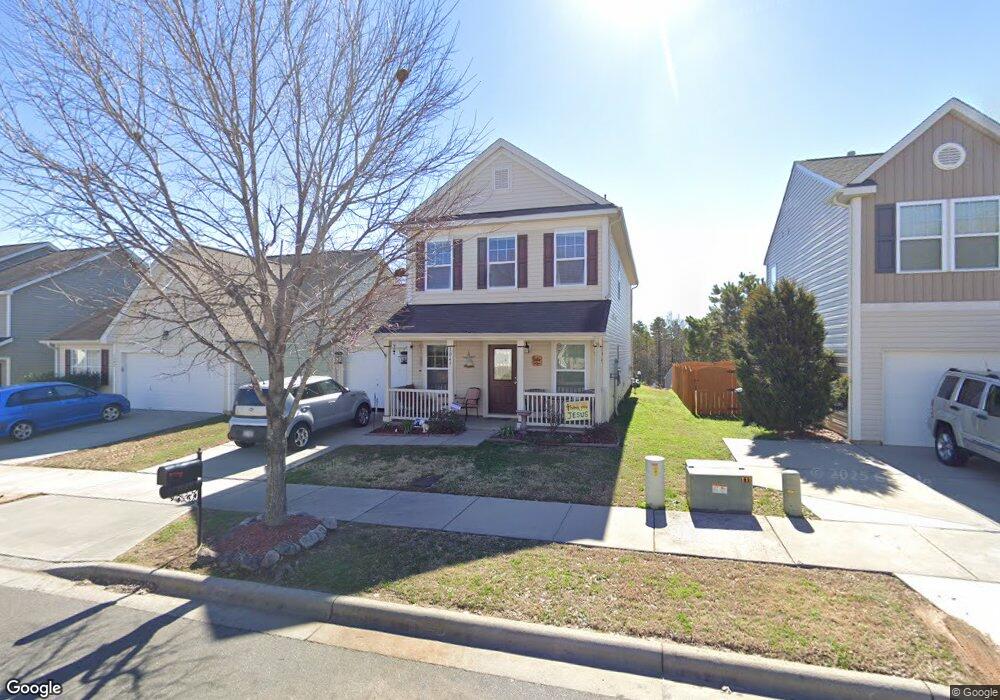
1049 Ramsgate Dr SW Concord, NC 28025
Estimated Value: $300,000 - $341,000
3
Beds
3
Baths
2,000
Sq Ft
$161/Sq Ft
Est. Value
About This Home
This home is located at 1049 Ramsgate Dr SW, Concord, NC 28025 and is currently estimated at $322,218, approximately $161 per square foot. 1049 Ramsgate Dr SW is a home located in Cabarrus County with nearby schools including A.T. Allen Elementary School, C.C. Griffin Middle School, and Central Cabarrus High School.
Ownership History
Date
Name
Owned For
Owner Type
Purchase Details
Closed on
Feb 27, 2012
Sold by
True Homes Llc
Bought by
Iorio Gerard and Iorio Kathleen M
Current Estimated Value
Home Financials for this Owner
Home Financials are based on the most recent Mortgage that was taken out on this home.
Original Mortgage
$123,965
Outstanding Balance
$85,155
Interest Rate
3.87%
Mortgage Type
FHA
Estimated Equity
$237,063
Purchase Details
Closed on
Mar 25, 2011
Sold by
Redus Charlotte Housing Llc
Bought by
True Homes Llc
Purchase Details
Closed on
May 14, 2008
Sold by
Dan Moser Co Inc
Bought by
Royce Homes North Carolina Llc
Home Financials for this Owner
Home Financials are based on the most recent Mortgage that was taken out on this home.
Original Mortgage
$25,000,000
Interest Rate
5.84%
Mortgage Type
Unknown
Create a Home Valuation Report for This Property
The Home Valuation Report is an in-depth analysis detailing your home's value as well as a comparison with similar homes in the area
Home Values in the Area
Average Home Value in this Area
Purchase History
| Date | Buyer | Sale Price | Title Company |
|---|---|---|---|
| Iorio Gerard | $128,000 | None Available | |
| True Homes Llc | $60,000 | None Available | |
| Royce Homes North Carolina Llc | $176,000 | None Available |
Source: Public Records
Mortgage History
| Date | Status | Borrower | Loan Amount |
|---|---|---|---|
| Open | Iorio Gerard | $123,965 | |
| Previous Owner | Royce Homes North Carolina Llc | $25,000,000 |
Source: Public Records
Tax History Compared to Growth
Tax History
| Year | Tax Paid | Tax Assessment Tax Assessment Total Assessment is a certain percentage of the fair market value that is determined by local assessors to be the total taxable value of land and additions on the property. | Land | Improvement |
|---|---|---|---|---|
| 2025 | $2,934 | $294,540 | $68,000 | $226,540 |
| 2024 | $2,934 | $294,540 | $68,000 | $226,540 |
| 2023 | $2,370 | $194,230 | $40,000 | $154,230 |
| 2022 | $2,370 | $194,230 | $40,000 | $154,230 |
| 2021 | $2,370 | $194,230 | $40,000 | $154,230 |
| 2020 | $2,370 | $194,230 | $40,000 | $154,230 |
| 2019 | $1,819 | $149,070 | $20,000 | $129,070 |
| 2018 | $1,784 | $148,630 | $20,000 | $128,630 |
| 2017 | $1,754 | $148,630 | $20,000 | $128,630 |
| 2016 | $1,040 | $134,690 | $24,000 | $110,690 |
| 2015 | $1,589 | $134,690 | $24,000 | $110,690 |
| 2014 | $1,589 | $134,690 | $24,000 | $110,690 |
Source: Public Records
Map
Nearby Homes
- 1051 Manston Place SW
- 4183 Broadstairs Dr
- 4175 Broadstairs Dr
- 4194 Clifftonville Ave SW
- 3931 Kellybrook Dr
- 668 Shellbark Dr
- 4425 Norfleet St
- 760 Bartram Ave Unit 114
- 4285 Long Arrow Dr
- 1130 Brigadoon Ct
- 1009 Braxton Dr
- 1001 Loch Lomond Cir
- 3560 Us Highway 601 S
- 4227 Kiser Woods Dr SW
- 4813 Adamshire Ave
- 5248 Ellie Ct
- 2752 State Highway 49
- 148 Woodland Dr SW
- 6175 U S 601
- 123 Softwind Ln
- 1045 Ramsgate Dr SW
- 1041 Ramsgate Dr SW
- 1053 Ramsgate Dr SW
- 1057 Ramsgate Dr SW
- 1071 Manston Place SW
- 1033 Ramsgate Dr SW
- 1075 Manston Place SW Unit 58
- 1061 Ramsgate Dr SW
- 1046 Ramsgate Dr SW
- 1067 Manston Place SW
- 1056 Ramsgate Dr SW
- 1052 Ramsgate Dr SW
- 1052 Ramsgate Dr SW Unit 153
- 1040 Ramsgate Dr SW
- 1063 Manston Place SW
- 1079 Manston Place SW
- 1029 Ramsgate Dr SW
- 1036 Ramsgate Dr SW
- 1059 Manston Place SW
- 1069 Ramsgate Dr SW