1049 Samuel Point Unit 52 Colorado Springs, CO 80906
Stratmoor Hills NeighborhoodEstimated Value: $304,908 - $317,000
3
Beds
3
Baths
1,528
Sq Ft
$203/Sq Ft
Est. Value
About This Home
This home is located at 1049 Samuel Point Unit 52, Colorado Springs, CO 80906 and is currently estimated at $309,977, approximately $202 per square foot. 1049 Samuel Point Unit 52 is a home located in El Paso County with nearby schools including Otero Elementary School, Fox Meadow Middle School, and Harrison High School.
Ownership History
Date
Name
Owned For
Owner Type
Purchase Details
Closed on
Mar 13, 2022
Sold by
Lee Neely Virginia
Bought by
David Michael Neely Irrevocable Trust
Current Estimated Value
Purchase Details
Closed on
Sep 18, 2002
Sold by
Mishler Trevor A
Bought by
Neely Virginia L
Purchase Details
Closed on
Jan 27, 2000
Sold by
Reno Alice A
Bought by
Mishler Trevor A
Home Financials for this Owner
Home Financials are based on the most recent Mortgage that was taken out on this home.
Original Mortgage
$123,420
Interest Rate
7.95%
Mortgage Type
VA
Purchase Details
Closed on
Nov 9, 1995
Sold by
Structural Management Of Colorado Inc
Bought by
Reno Alice A
Home Financials for this Owner
Home Financials are based on the most recent Mortgage that was taken out on this home.
Original Mortgage
$88,200
Interest Rate
7.64%
Create a Home Valuation Report for This Property
The Home Valuation Report is an in-depth analysis detailing your home's value as well as a comparison with similar homes in the area
Home Values in the Area
Average Home Value in this Area
Purchase History
| Date | Buyer | Sale Price | Title Company |
|---|---|---|---|
| David Michael Neely Irrevocable Trust | -- | None Listed On Document | |
| Neely Virginia L | $132,900 | -- | |
| Mishler Trevor A | $121,000 | Unified Title Co Inc | |
| Reno Alice A | $113,203 | Security Title |
Source: Public Records
Mortgage History
| Date | Status | Borrower | Loan Amount |
|---|---|---|---|
| Previous Owner | Mishler Trevor A | $123,420 | |
| Previous Owner | Reno Alice A | $88,200 |
Source: Public Records
Tax History Compared to Growth
Tax History
| Year | Tax Paid | Tax Assessment Tax Assessment Total Assessment is a certain percentage of the fair market value that is determined by local assessors to be the total taxable value of land and additions on the property. | Land | Improvement |
|---|---|---|---|---|
| 2025 | $1,005 | $21,510 | -- | -- |
| 2024 | $763 | $21,170 | $4,690 | $16,480 |
| 2022 | $879 | $16,300 | $3,130 | $13,170 |
| 2021 | $939 | $16,770 | $3,220 | $13,550 |
| 2020 | $929 | $14,250 | $2,150 | $12,100 |
| 2019 | $900 | $14,250 | $2,150 | $12,100 |
| 2018 | $828 | $12,610 | $1,730 | $10,880 |
| 2017 | $632 | $12,610 | $1,730 | $10,880 |
| 2016 | $647 | $12,120 | $1,750 | $10,370 |
| 2015 | $647 | $12,120 | $1,750 | $10,370 |
| 2014 | $628 | $11,620 | $1,750 | $9,870 |
Source: Public Records
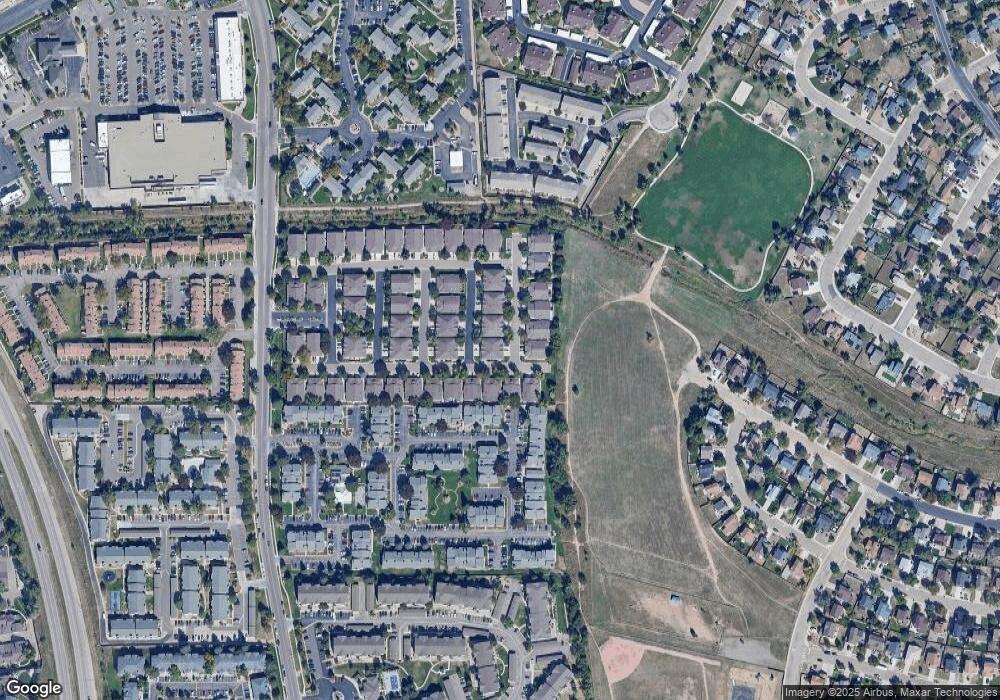
Map
Nearby Homes
- 3930 Leah Heights Unit 16
- 3914 Leah Heights Unit 108
- 1244 Samuel Point Unit 1
- 3884 Packers Point
- 1025 Cheyenne Villas Point
- 3916 Red Cedar Dr
- 938 London Green Way
- 1565 Charmwood Dr
- 906 London Green Way
- 3630 Strawberry Field Grove Unit G
- 865 San Antonio Place
- 720 Crown Point Dr
- 4573 Prestige Point
- 1457 S Canoe Creek Dr
- 3865 Rosemere St
- 3640 San Pedro Ct
- 825 San Gabriel Place
- 1250 Cheyenne Meadows Rd
- 1518 S Canoe Creek Dr
- 1450 Gumwood Dr
- 3927 Christy Heights
- 1053 Samuel Point
- 3923 Christy Heights Unit 49
- 1041 Samuel Point Unit 48
- 3919 Christy Heights Unit 47
- 3919 Christy Heights Unit 1947
- 3915 Christy Heights Unit 79
- 1037 Samuel Point Unit 80
- 1052 Samuel Point Unit 60
- 3930 Christy Heights Unit 42
- 1033 Samuel Point Unit 78
- 1048 Samuel Point Unit 61
- 1056 Samuel Point Unit 59
- 3926 Christy Heights Unit 40
- 1118 Samuel Point Unit 38
- 1122 Samuel Point
- 3922 Christy Heights Unit 46
- 1114 Samuel Point Unit 55
- 3911 Christy Heights Unit 77
- 1044 Samuel Point Unit 62