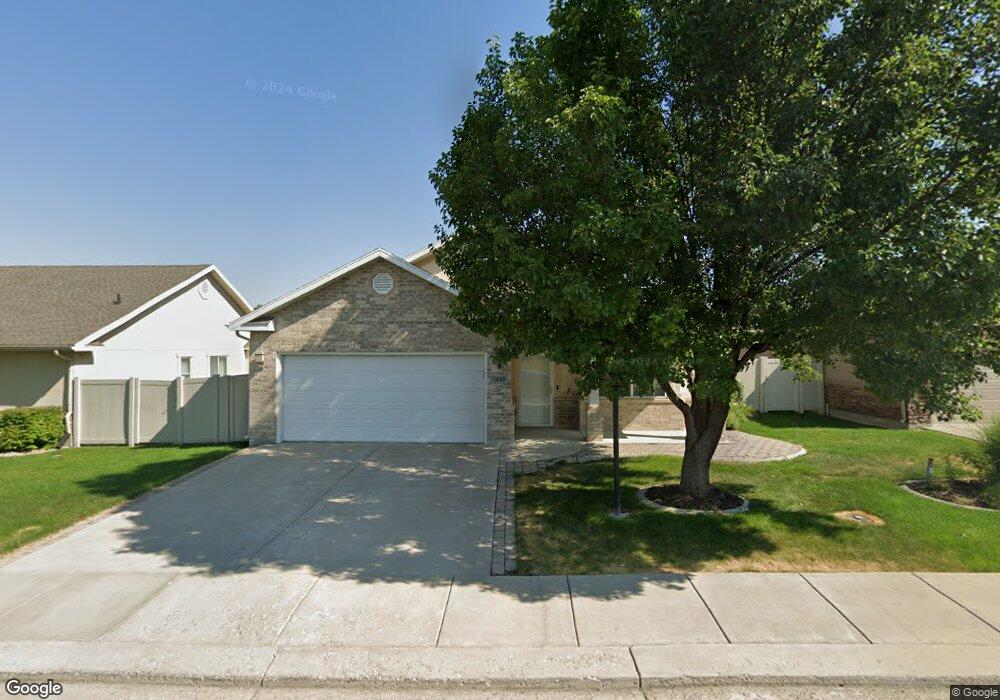
1049 W 2770 S Nibley, UT 84321
Estimated Value: $472,977 - $538,000
3
Beds
2
Baths
1,989
Sq Ft
$255/Sq Ft
Est. Value
About This Home
This home is located at 1049 W 2770 S, Nibley, UT 84321 and is currently estimated at $506,244, approximately $254 per square foot. 1049 W 2770 S is a home located in Cache County with nearby schools including Nibley School, Spring Creek Middle School, and South Cache Middle School.
Ownership History
Date
Name
Owned For
Owner Type
Purchase Details
Closed on
May 8, 2024
Sold by
Schwen Karen
Bought by
Summers Ranch Llc
Current Estimated Value
Purchase Details
Closed on
Feb 10, 2021
Sold by
Selley Cindy J and Selley Jeremy Kent
Bought by
Schwen Karen
Purchase Details
Closed on
Feb 6, 2018
Sold by
Selley Cindy J
Bought by
Selley Cindy J and Selley Jeremy Kent
Purchase Details
Closed on
Aug 11, 2016
Sold by
Selley Cindy J
Bought by
Selley Cindy J and Kent Jeremy
Purchase Details
Closed on
Oct 5, 2005
Sold by
Selley Kent Lee and Selley Cindy J
Bought by
Selley Kent and Selley Cindy
Home Financials for this Owner
Home Financials are based on the most recent Mortgage that was taken out on this home.
Original Mortgage
$25,000
Interest Rate
5.63%
Mortgage Type
Purchase Money Mortgage
Create a Home Valuation Report for This Property
The Home Valuation Report is an in-depth analysis detailing your home's value as well as a comparison with similar homes in the area
Home Values in the Area
Average Home Value in this Area
Purchase History
| Date | Buyer | Sale Price | Title Company |
|---|---|---|---|
| Summers Ranch Llc | -- | Northern Title Company | |
| Schwen Karen | -- | American Secure Title Logan | |
| Selley Cindy J | -- | -- | |
| Selley Cindy J | -- | Northern Title | |
| Selley Kent | -- | Northern Title Company | |
| Selley Kent Lee | -- | Northern Title Company |
Source: Public Records
Mortgage History
| Date | Status | Borrower | Loan Amount |
|---|---|---|---|
| Previous Owner | Selley Kent Lee | $25,000 |
Source: Public Records
Tax History Compared to Growth
Tax History
| Year | Tax Paid | Tax Assessment Tax Assessment Total Assessment is a certain percentage of the fair market value that is determined by local assessors to be the total taxable value of land and additions on the property. | Land | Improvement |
|---|---|---|---|---|
| 2025 | $1,983 | $262,840 | $0 | $0 |
| 2024 | $2,114 | $263,105 | $0 | $0 |
| 2023 | $1,985 | $231,360 | $0 | $0 |
| 2022 | $2,066 | $231,355 | $0 | $0 |
| 2021 | $1,993 | $346,520 | $50,000 | $296,520 |
| 2020 | $1,762 | $291,742 | $50,000 | $241,742 |
| 2019 | $1,849 | $291,741 | $50,000 | $241,741 |
| 2018 | $1,612 | $248,210 | $38,000 | $210,210 |
| 2017 | $1,545 | $126,005 | $0 | $0 |
| 2016 | $1,562 | $126,005 | $0 | $0 |
| 2015 | $1,243 | $100,945 | $0 | $0 |
| 2014 | $1,215 | $100,945 | $0 | $0 |
| 2013 | -- | $102,320 | $0 | $0 |
Source: Public Records
Map
Nearby Homes
- 1039 W 2770 S
- 2762 S 1070 W
- 1029 W 2770 S Unit 24
- 1029 W 2770 S
- 1029 Sunset Park
- 1052 W 2770 S Unit 2
- 1052 Sunset Park
- 2752 Sunset Cir
- 1044 W 2770 S
- 1060 Sunset Park
- 2751 S 1070 W
- 1068 Sunset Park
- 2744 S 1070 W
- 2763 S 1070 W
- 2771 S 1070 W
- 2779 S 1070 W
- 1076 W 2770 S
- 2766 S 1020 W
- 2758 S 1020 W
- 1041 Sunset Park