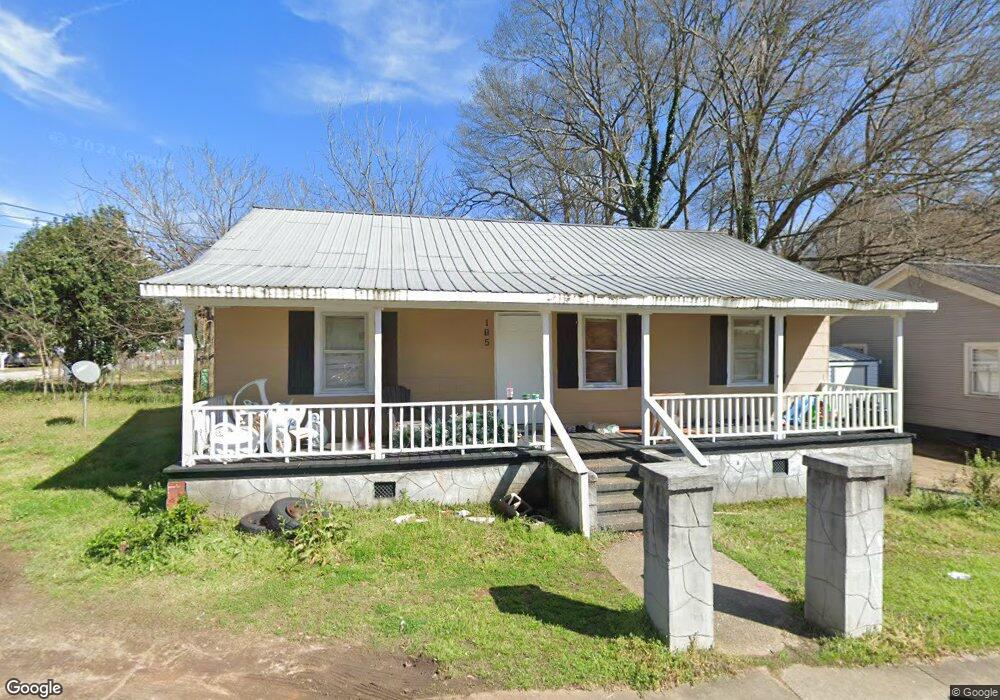
105 Addie St Unit 1 Lagrange, GA 30241
Estimated Value: $52,000 - $98,000
3
Beds
2
Baths
1,028
Sq Ft
$73/Sq Ft
Est. Value
About This Home
This home is located at 105 Addie St Unit 1, Lagrange, GA 30241 and is currently estimated at $74,619, approximately $72 per square foot. 105 Addie St Unit 1 is a home located in Troup County with nearby schools including Hollis Hand Elementary School, Franklin Forest Elementary School, and Ethel W. Kight Elementary School.
Ownership History
Date
Name
Owned For
Owner Type
Purchase Details
Closed on
Oct 25, 2019
Sold by
Oates Sojournia R
Bought by
Battle Kaskaskius
Current Estimated Value
Purchase Details
Closed on
Mar 17, 2016
Sold by
David Bradley Rentals Llc
Bought by
Oates Sojournia R
Purchase Details
Closed on
Jul 27, 1992
Sold by
Mansour Geraud Joseph
Bought by
Perry David Bradley
Purchase Details
Closed on
May 17, 1982
Sold by
Smith Truitt
Bought by
Mansour Geraud Joseph
Purchase Details
Closed on
Jun 27, 1979
Sold by
Jabaley Prop Inc
Bought by
Smith Truitt
Purchase Details
Closed on
Jan 26, 1979
Sold by
Lag Bank -Trustee
Bought by
Jabaley Prop Inc
Purchase Details
Closed on
Jul 22, 1977
Sold by
Gallant J G
Bought by
Lag Bank -Trustee
Purchase Details
Closed on
Jan 1, 1970
Sold by
Mayfield Willie M
Bought by
Gallant J G
Purchase Details
Closed on
Jan 1, 1961
Sold by
Robinson B W
Bought by
Mayfield Willie M
Create a Home Valuation Report for This Property
The Home Valuation Report is an in-depth analysis detailing your home's value as well as a comparison with similar homes in the area
Home Values in the Area
Average Home Value in this Area
Purchase History
| Date | Buyer | Sale Price | Title Company |
|---|---|---|---|
| Battle Kaskaskius | $22,000 | -- | |
| Oates Sojournia R | $14,575 | -- | |
| Perry David Bradley | $7,000 | -- | |
| Mansour Geraud Joseph | $10,000 | -- | |
| Smith Truitt | -- | -- | |
| Jabaley Prop Inc | -- | -- | |
| Lag Bank -Trustee | -- | -- | |
| Gallant J G | $3,000 | -- | |
| Mayfield Willie M | -- | -- |
Source: Public Records
Tax History Compared to Growth
Tax History
| Year | Tax Paid | Tax Assessment Tax Assessment Total Assessment is a certain percentage of the fair market value that is determined by local assessors to be the total taxable value of land and additions on the property. | Land | Improvement |
|---|---|---|---|---|
| 2024 | $479 | $17,560 | $2,800 | $14,760 |
| 2023 | $419 | $15,360 | $2,800 | $12,560 |
| 2022 | $406 | $14,560 | $2,800 | $11,760 |
| 2021 | $408 | $13,520 | $920 | $12,600 |
| 2020 | $265 | $13,520 | $920 | $12,600 |
| 2019 | $371 | $12,316 | $1,036 | $11,280 |
| 2018 | $371 | $12,316 | $1,036 | $11,280 |
| 2017 | $91 | $12,316 | $1,036 | $11,280 |
| 2016 | $360 | $11,934 | $1,036 | $10,898 |
| 2015 | $361 | $11,934 | $1,036 | $10,898 |
| 2014 | $396 | $13,084 | $1,036 | $12,048 |
| 2013 | -- | $14,091 | $1,036 | $13,055 |
Source: Public Records
Map
Nearby Homes
- 101 McGee St
- 141 Main St
- 910 N 916 1000 1002 N Oak & 1011 1019 1021 Johnson St
- 803 1/2 Hines St
- 203 Fannin St
- 205 Fannin St
- 0 Locust St
- 105 Dix St
- 505 S Lewis St
- 509 S Lewis St
- 519 Greenville St
- 206 Broad St
- 303 E Mulberry St
- 801 Hines St
- 516 S Lewis St
- 0 Burr St
- 306 Burr St
- 206 Peachtree St
- 208 Render St
- 203 Revis St