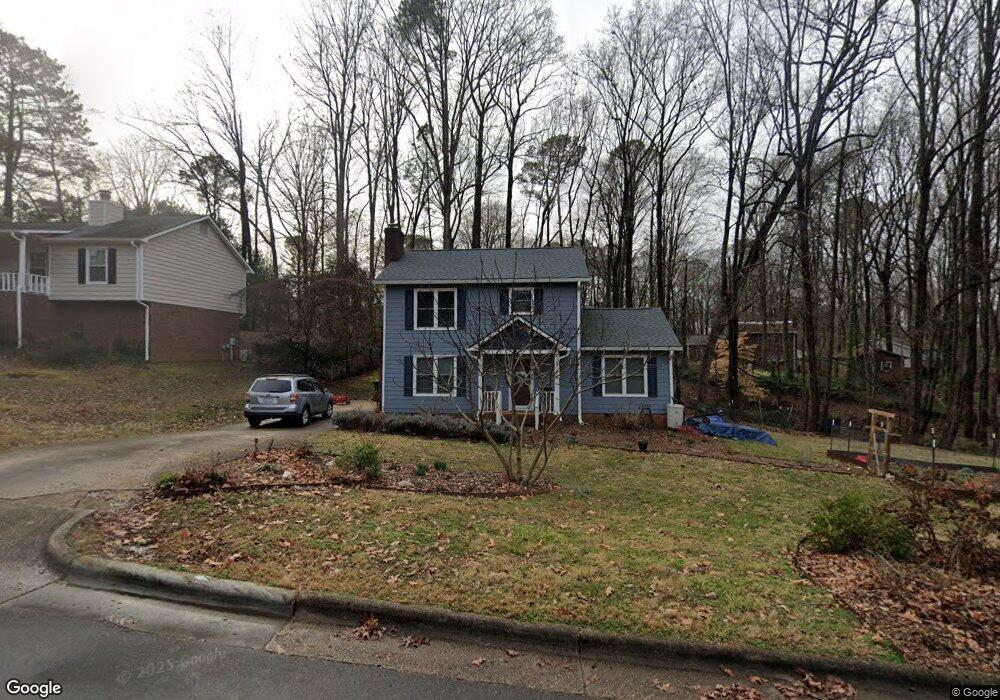
105 Antler Point Dr Cary, NC 27513
West Cary NeighborhoodEstimated Value: $429,000 - $452,000
3
Beds
3
Baths
1,490
Sq Ft
$295/Sq Ft
Est. Value
About This Home
This home is located at 105 Antler Point Dr, Cary, NC 27513 and is currently estimated at $439,440, approximately $294 per square foot. 105 Antler Point Dr is a home located in Wake County with nearby schools including Briarcliff Elementary School, East Cary Middle School, and Cary High School.
Ownership History
Date
Name
Owned For
Owner Type
Purchase Details
Closed on
May 1, 2020
Sold by
Opendoor Homes Phoenix 2 Llc
Bought by
Bless Athena Carol Thomasson and Bless Samantha Thomasson
Current Estimated Value
Home Financials for this Owner
Home Financials are based on the most recent Mortgage that was taken out on this home.
Original Mortgage
$246,411
Outstanding Balance
$218,354
Interest Rate
3.3%
Mortgage Type
New Conventional
Estimated Equity
$221,086
Purchase Details
Closed on
Jan 9, 2020
Sold by
Harrell Dylan Taylor and Harrell Kim Cherie
Bought by
Opendoor Homes Phoenix 2 Llc
Purchase Details
Closed on
Apr 10, 2002
Sold by
Chasalow Fred L and Chasalow Sandra B
Bought by
Harrell Dylan Taylor and Harrell Kim Cherie
Home Financials for this Owner
Home Financials are based on the most recent Mortgage that was taken out on this home.
Original Mortgage
$141,978
Interest Rate
6.89%
Mortgage Type
FHA
Create a Home Valuation Report for This Property
The Home Valuation Report is an in-depth analysis detailing your home's value as well as a comparison with similar homes in the area
Home Values in the Area
Average Home Value in this Area
Purchase History
| Date | Buyer | Sale Price | Title Company |
|---|---|---|---|
| Bless Athena Carol Thomasson | $259,500 | None Available | |
| Opendoor Homes Phoenix 2 Llc | $260,500 | None Available | |
| Harrell Dylan Taylor | $143,500 | -- |
Source: Public Records
Mortgage History
| Date | Status | Borrower | Loan Amount |
|---|---|---|---|
| Open | Bless Athena Carol Thomasson | $246,411 | |
| Previous Owner | Harrell Dylan Taylor | $141,978 | |
| Closed | Opendoor Homes Phoenix 2 Llc | $0 |
Source: Public Records
Tax History
| Year | Tax Paid | Tax Assessment Tax Assessment Total Assessment is a certain percentage of the fair market value that is determined by local assessors to be the total taxable value of land and additions on the property. | Land | Improvement |
|---|---|---|---|---|
| 2025 | $3,619 | $419,864 | $220,000 | $199,864 |
| 2024 | $3,541 | $419,864 | $220,000 | $199,864 |
Source: Public Records
Map
Nearby Homes
- 1027 Castalia Dr
- 1008 Castalia Dr
- 203 Wood Hollow Dr
- 132 Edgehill Pkwy
- 631 Springfork Dr Unit 5C3
- 136 Lake Hollow Cir
- 109 Virginia Place
- 322 Belrose Dr
- 133 Oakmere Dr
- 217 Oakmere Dr
- 136 Orchard Park Dr
- 1209 Cedar Creek Dr
- 101 Hedgerow Ct
- 209 High House Rd
- 100 Hunting Chase Unit 1D
- 207 High House Rd
- 113 Ravenna Way
- 143 Hedgerow Ct
- 123 Donna Place
- 102 Joel Ct
- 103 Antler Point Dr
- 108 Black Bear Ct
- 106 Black Bear Ct
- 104 Black Bear Ct
- 1104 Castalia Dr
- 109 Antler Point Dr
- 1102 Castalia Dr
- 106 Antler Point Dr
- 104 Antler Point Dr
- 110 Black Bear Ct
- 1106 Castalia Dr
- 1026 Castalia Dr
- 108 Antler Point Dr
- 111 Antler Point Dr
- 3 Antler Point Dr
- 4 Antler Point Dr
- 1024 Castalia Dr
- 111 Black Bear Ct
- 105 Black Bear Ct
- 109 Black Bear Ct
Your Personal Tour Guide
Ask me questions while you tour the home.