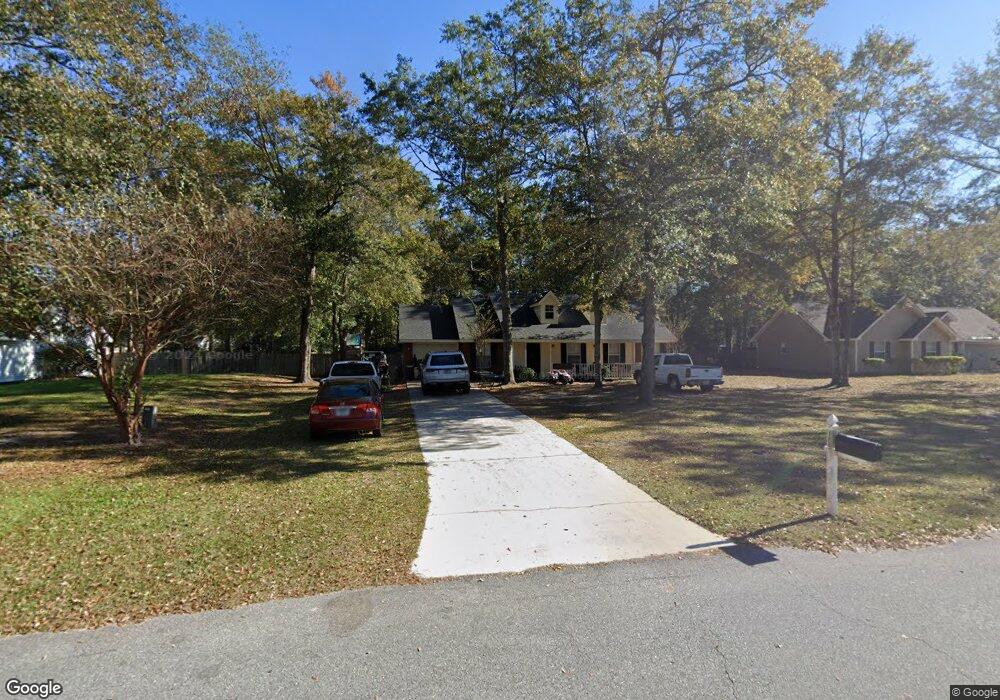
105 Ashley Dr Guyton, GA 31312
Estimated Value: $248,000 - $284,847
3
Beds
2
Baths
1,320
Sq Ft
$201/Sq Ft
Est. Value
About This Home
This home is located at 105 Ashley Dr, Guyton, GA 31312 and is currently estimated at $264,962, approximately $200 per square foot. 105 Ashley Dr is a home located in Effingham County with nearby schools including Sand Hill Elementary School, South Effingham Middle School, and South Effingham High School.
Ownership History
Date
Name
Owned For
Owner Type
Purchase Details
Closed on
Feb 21, 2025
Sold by
Deforest Alice L
Bought by
Stirling Joseph Thomas
Current Estimated Value
Home Financials for this Owner
Home Financials are based on the most recent Mortgage that was taken out on this home.
Original Mortgage
$255,375
Outstanding Balance
$255,164
Interest Rate
6.96%
Mortgage Type
VA
Estimated Equity
$9,798
Purchase Details
Closed on
Jan 24, 2008
Sold by
Aldc Realty Services Llc
Bought by
Deforest Alice L and Deforest Mark D
Home Financials for this Owner
Home Financials are based on the most recent Mortgage that was taken out on this home.
Original Mortgage
$108,120
Interest Rate
6.06%
Mortgage Type
New Conventional
Purchase Details
Closed on
Mar 17, 2006
Sold by
Deforest Mark D
Bought by
Ald Reality Svcs Llc
Create a Home Valuation Report for This Property
The Home Valuation Report is an in-depth analysis detailing your home's value as well as a comparison with similar homes in the area
Home Values in the Area
Average Home Value in this Area
Purchase History
| Date | Buyer | Sale Price | Title Company |
|---|---|---|---|
| Stirling Joseph Thomas | $250,000 | -- | |
| Deforest Alice L | -- | -- | |
| Ald Reality Svcs Llc | -- | -- |
Source: Public Records
Mortgage History
| Date | Status | Borrower | Loan Amount |
|---|---|---|---|
| Open | Stirling Joseph Thomas | $255,375 | |
| Previous Owner | Deforest Alice L | $108,120 |
Source: Public Records
Tax History Compared to Growth
Tax History
| Year | Tax Paid | Tax Assessment Tax Assessment Total Assessment is a certain percentage of the fair market value that is determined by local assessors to be the total taxable value of land and additions on the property. | Land | Improvement |
|---|---|---|---|---|
| 2024 | $3,514 | $98,719 | $24,000 | $74,719 |
| 2023 | $2,363 | $74,830 | $24,000 | $50,830 |
| 2022 | $2,178 | $63,587 | $14,800 | $48,787 |
| 2021 | $2,009 | $57,789 | $14,000 | $43,789 |
| 2020 | $2,001 | $58,274 | $12,000 | $46,274 |
| 2019 | $1,813 | $51,499 | $10,760 | $40,739 |
| 2018 | $1,844 | $51,993 | $10,760 | $41,233 |
| 2017 | $1,754 | $48,593 | $10,760 | $37,833 |
| 2016 | $1,590 | $45,390 | $10,000 | $35,390 |
| 2015 | -- | $43,390 | $8,000 | $35,390 |
| 2014 | -- | $43,390 | $8,000 | $35,390 |
| 2013 | -- | $40,990 | $5,600 | $35,390 |
Source: Public Records
Map
Nearby Homes
- 115 Ashley Dr
- 304 Ashley Ln
- 102 Serenoa Dr
- 100 Serenoa Dr
- 105 Sumter Rd
- 120 Greenbriar Dr
- 93 Pineora Estates Dr
- 538 4th St
- 106 Greenbriar Dr
- 164 6th St
- 100 Kingsley Dr N
- Tract 3 Williams St
- 131 Live Oak Dr
- 517 Adelante Ln
- 308 Barrister Cir
- 285 Barrister Cir
- 280 Barrister Cir
- 520 Glory Dr
- 107 Cameron Oaks Dr
- 3478 Georgia 17