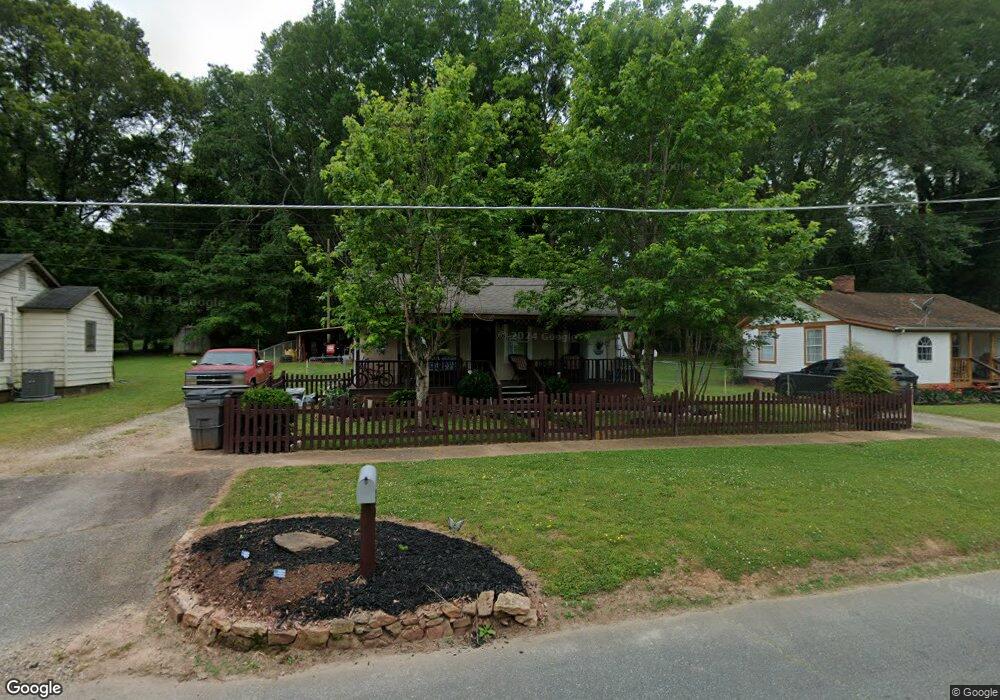
105 Baugh Ave Hogansville, GA 30230
Estimated Value: $139,878 - $203,000
3
Beds
2
Baths
1,029
Sq Ft
$180/Sq Ft
Est. Value
About This Home
This home is located at 105 Baugh Ave, Hogansville, GA 30230 and is currently estimated at $184,970, approximately $179 per square foot. 105 Baugh Ave is a home located in Troup County with nearby schools including Hogansville Elementary School, Callaway Elementary School, and Callaway Middle School.
Ownership History
Date
Name
Owned For
Owner Type
Purchase Details
Closed on
Sep 19, 2024
Sold by
Weir Katrina Lynn
Bought by
Gazaway Michael L and Weir Katrina Lynn
Current Estimated Value
Purchase Details
Closed on
Sep 28, 1992
Sold by
Billy Spradlin
Bought by
Spradlin Billy D and Spradlin Eunice
Purchase Details
Closed on
Mar 27, 1992
Sold by
C B and T B
Bought by
Billy Spradlin
Purchase Details
Closed on
Mar 3, 1992
Sold by
Bobby L Clark
Bought by
C B and T B
Purchase Details
Closed on
Jan 1, 1987
Sold by
Kathy G Clark
Bought by
Bobby L Clark
Purchase Details
Closed on
Oct 1, 1985
Sold by
Ellen Wm C and Ellen Terrell
Bought by
Kathy G Clark
Purchase Details
Closed on
Jun 1, 1984
Sold by
Billy D Spradlin
Bought by
Ellen Wm C and Ellen Terrell
Purchase Details
Closed on
Apr 1, 1984
Bought by
Billy D Spradlin
Purchase Details
Closed on
Nov 15, 1976
Purchase Details
Closed on
Nov 12, 1976
Sold by
Jones Et-Al
Purchase Details
Closed on
Aug 1, 1946
Bought by
Jones Et-Al
Create a Home Valuation Report for This Property
The Home Valuation Report is an in-depth analysis detailing your home's value as well as a comparison with similar homes in the area
Home Values in the Area
Average Home Value in this Area
Purchase History
| Date | Buyer | Sale Price | Title Company |
|---|---|---|---|
| Gazaway Michael L | -- | -- | |
| Spradlin Billy D | -- | -- | |
| Billy Spradlin | -- | -- | |
| C B | -- | -- | |
| Bobby L Clark | -- | -- | |
| Kathy G Clark | -- | -- | |
| Ellen Wm C | -- | -- | |
| Billy D Spradlin | -- | -- | |
| -- | -- | -- | |
| -- | -- | -- | |
| Jones Et-Al | -- | -- |
Source: Public Records
Tax History Compared to Growth
Tax History
| Year | Tax Paid | Tax Assessment Tax Assessment Total Assessment is a certain percentage of the fair market value that is determined by local assessors to be the total taxable value of land and additions on the property. | Land | Improvement |
|---|---|---|---|---|
| 2024 | $1,068 | $30,320 | $8,000 | $22,320 |
| 2023 | $1,010 | $28,680 | $8,000 | $20,680 |
| 2022 | $624 | $17,400 | $4,000 | $13,400 |
| 2021 | $477 | $12,520 | $1,640 | $10,880 |
| 2020 | $294 | $7,720 | $1,640 | $6,080 |
| 2019 | $289 | $7,590 | $1,830 | $5,760 |
| 2018 | $269 | $7,070 | $1,830 | $5,240 |
| 2017 | $269 | $7,070 | $1,830 | $5,240 |
| 2016 | $275 | $7,215 | $1,830 | $5,385 |
| 2015 | $268 | $7,028 | $1,643 | $5,385 |
| 2014 | $269 | $7,028 | $1,643 | $5,385 |
| 2013 | -- | $7,521 | $1,643 | $5,878 |
Source: Public Records
Map
Nearby Homes
- 215 Johnson St
- 208 Church St
- 213 Johnson St
- 100 International St
- 400 Lawrence St
- 407 Green Ave
- 214 Collier St
- 0 Georgia 100 Unit 10591508
- 613 Rifle Ridge
- 617 Rifle Ridge
- 619 Rifle Ridge
- 608 Rifle Ridge
- 614 Rifle Ridge
- 201 Oak St
- 117 Duck Walk Way
- 209 Duck Walk Way
- 203 White Ave
- 205 White St
- 606 Green Ave
- 341 Foxtrot Trail
- 107 Baugh Ave
- 103 Baugh Ave
- 109 Baugh Ave
- 101 Baugh Ave
- 110 Baugh Ave
- 110 Greenough St
- 106 Baugh Ave
- 108 Greenough St
- 108 Baugh Ave
- 104 Baugh Ave
- 106 Greenough St Unit BLOCK/LOT 9
- 106 Greenough St
- 200 Greenough St
- 221 Johnson St
- 223 Johnson St
- 102 Baugh Ave
- 0 Greenough St Unit 7341064
- 0 Greenough St Unit 8438572
- 0 Greenough St Unit 8196603
- 0 Greenough St Unit 7588767