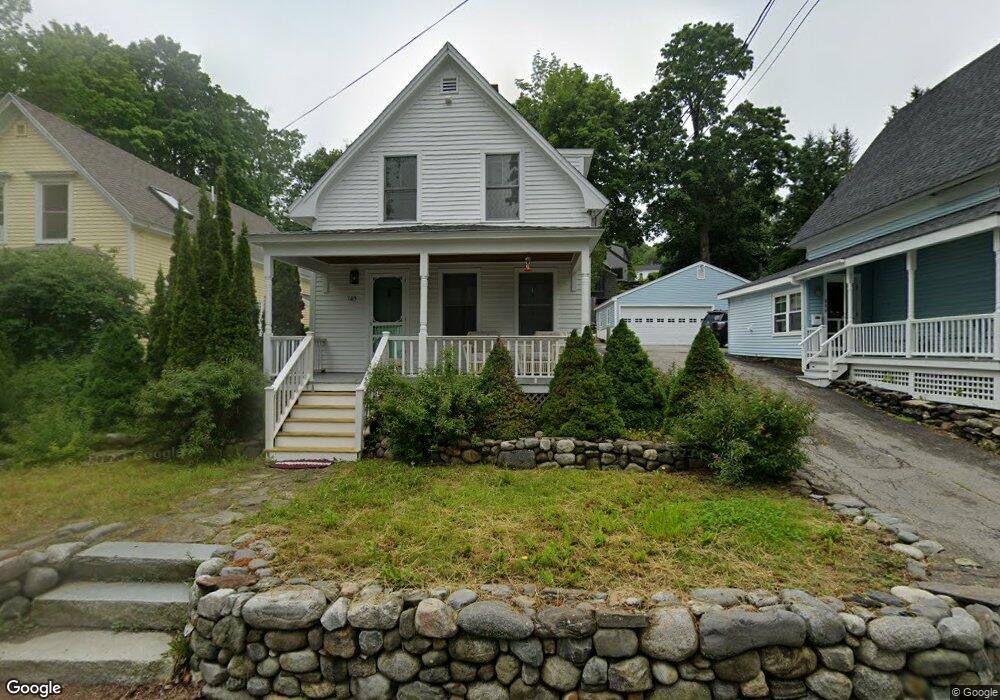
105 Bayview St Camden, ME 04843
Estimated Value: $906,000 - $1,168,000
2
Beds
1
Bath
1,050
Sq Ft
$948/Sq Ft
Est. Value
About This Home
This home is located at 105 Bayview St, Camden, ME 04843 and is currently estimated at $995,832, approximately $948 per square foot. 105 Bayview St is a home located in Knox County with nearby schools including Camden-Rockport Elementary School, Camden-Rockport Middle School, and Camden Hills Regional High School.
Ownership History
Date
Name
Owned For
Owner Type
Purchase Details
Closed on
Feb 8, 2023
Sold by
Norton Derek M
Bought by
Lee Reinhold
Current Estimated Value
Home Financials for this Owner
Home Financials are based on the most recent Mortgage that was taken out on this home.
Original Mortgage
$616,000
Outstanding Balance
$596,846
Interest Rate
6.38%
Mortgage Type
Purchase Money Mortgage
Estimated Equity
$398,986
Purchase Details
Closed on
Nov 14, 2013
Sold by
Siem Joan
Bought by
Norton Derek M
Home Financials for this Owner
Home Financials are based on the most recent Mortgage that was taken out on this home.
Original Mortgage
$235,625
Interest Rate
4.24%
Mortgage Type
New Conventional
Create a Home Valuation Report for This Property
The Home Valuation Report is an in-depth analysis detailing your home's value as well as a comparison with similar homes in the area
Home Values in the Area
Average Home Value in this Area
Purchase History
| Date | Buyer | Sale Price | Title Company |
|---|---|---|---|
| Lee Reinhold | $770,000 | None Available | |
| Norton Derek M | -- | -- |
Source: Public Records
Mortgage History
| Date | Status | Borrower | Loan Amount |
|---|---|---|---|
| Open | Lee Reinhold | $616,000 | |
| Previous Owner | Norton Derek M | $235,625 |
Source: Public Records
Tax History Compared to Growth
Tax History
| Year | Tax Paid | Tax Assessment Tax Assessment Total Assessment is a certain percentage of the fair market value that is determined by local assessors to be the total taxable value of land and additions on the property. | Land | Improvement |
|---|---|---|---|---|
| 2024 | $9,381 | $893,400 | $564,600 | $328,800 |
| 2023 | $8,850 | $641,300 | $324,800 | $316,500 |
| 2022 | $7,507 | $568,700 | $324,800 | $243,900 |
| 2021 | $7,328 | $477,400 | $302,500 | $174,900 |
| 2020 | $7,175 | $477,400 | $302,500 | $174,900 |
| 2019 | $7,118 | $477,400 | $302,500 | $174,900 |
| 2018 | $6,373 | $428,300 | $288,600 | $139,700 |
| 2017 | $6,159 | $428,300 | $288,600 | $139,700 |
| 2016 | $4,975 | $319,100 | $199,600 | $119,500 |
| 2015 | $4,828 | $319,100 | $199,600 | $119,500 |
| 2014 | $4,605 | $319,100 | $199,600 | $119,500 |
| 2013 | $4,324 | $308,000 | $199,600 | $108,400 |
Source: Public Records
Map
Nearby Homes