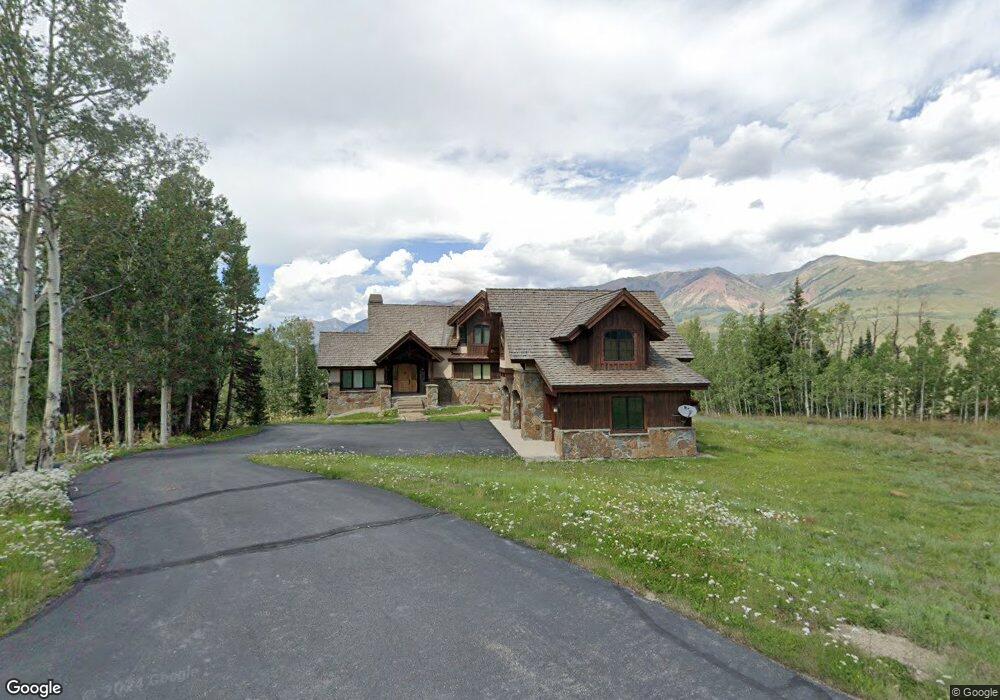
105 Bear Scratch Unit Lot D5, Prospect at Mt. Crested Butte, CO 81225
Estimated Value: $5,224,000 - $6,332,000
--
Bed
6
Baths
4,440
Sq Ft
$1,333/Sq Ft
Est. Value
About This Home
This home is located at 105 Bear Scratch Unit Lot D5, Prospect at, Mt. Crested Butte, CO 81225 and is currently estimated at $5,919,980, approximately $1,333 per square foot. 105 Bear Scratch Unit Lot D5, Prospect at is a home located in Gunnison County with nearby schools including Gunnison Elementary School, Crested Butte Community School, and Gunnison Middle School.
Ownership History
Date
Name
Owned For
Owner Type
Purchase Details
Closed on
Nov 4, 2024
Sold by
Bpw Re Holdings Llc
Bought by
105 Bear Scratch Llc
Current Estimated Value
Home Financials for this Owner
Home Financials are based on the most recent Mortgage that was taken out on this home.
Original Mortgage
$4,091,500
Outstanding Balance
$4,050,538
Interest Rate
6.09%
Mortgage Type
New Conventional
Estimated Equity
$1,869,442
Purchase Details
Closed on
Dec 23, 2011
Sold by
Ad And Ea Bell Living Trst
Bought by
Bpw Re Holdings Llc
Purchase Details
Closed on
Jan 15, 2010
Sold by
Bell Elizabeth A
Bought by
Bell A D and Bell Elizabeth A
Purchase Details
Closed on
Aug 10, 2007
Sold by
Bell Elizabeth Walker
Bought by
Bell Elizabeth A
Create a Home Valuation Report for This Property
The Home Valuation Report is an in-depth analysis detailing your home's value as well as a comparison with similar homes in the area
Home Values in the Area
Average Home Value in this Area
Purchase History
| Date | Buyer | Sale Price | Title Company |
|---|---|---|---|
| 105 Bear Scratch Llc | $5,845,000 | Land Title | |
| Bpw Re Holdings Llc | $4,000,000 | None Available | |
| Bell A D | -- | None Available | |
| Bell Elizabeth A | -- | None Available |
Source: Public Records
Mortgage History
| Date | Status | Borrower | Loan Amount |
|---|---|---|---|
| Open | 105 Bear Scratch Llc | $4,091,500 |
Source: Public Records
Tax History Compared to Growth
Tax History
| Year | Tax Paid | Tax Assessment Tax Assessment Total Assessment is a certain percentage of the fair market value that is determined by local assessors to be the total taxable value of land and additions on the property. | Land | Improvement |
|---|---|---|---|---|
| 2024 | $49,891 | $479,370 | $72,010 | $407,360 |
| 2023 | $63,018 | $475,680 | $71,450 | $404,230 |
| 2022 | $48,164 | $363,560 | $38,800 | $324,760 |
| 2021 | $45,626 | $374,020 | $39,920 | $334,100 |
| 2020 | $45,810 | $343,440 | $29,630 | $313,810 |
| 2019 | $45,406 | $343,440 | $29,630 | $313,810 |
| 2018 | $42,812 | $302,910 | $26,280 | $276,630 |
| 2017 | $43,003 | $302,910 | $26,280 | $276,630 |
| 2016 | $43,124 | $324,250 | $23,100 | $301,150 |
| 2015 | -- | $324,250 | $23,100 | $301,150 |
| 2014 | -- | $326,030 | $22,330 | $303,700 |
Source: Public Records
Map
Nearby Homes
- E42 Prospect Dr
- E23 Prospect Dr
- E31 Prospect Dr
- E30 Prospect Dr
- E29 Prospect Dr
- E22 Prospect Dr
- E24 Prospect Dr
- E35 Prospect Dr
- 28 Kokanee Ln
- 702 Prospect Dr
- E32 Prospect Dr
- 605 Prospect Dr
- E36 Prospect Dr
- E43 Prospect Dr
- 18 Walking Deer Ln
- 23 Gray Fox Ln
- 14 Walking Deer Ln
- 22 Gray Fox Ln
- 8 Appaloosa Rd
- 99 Anthracite Dr
- 105 Bear Scratch
- 0 Bear Scratch Ln Unit 758927
- 0 Bear Scratch Ln Unit 750875
- 0 Bear Scratch Ln Unit 750271
- 0 Bear Scratch Ln Unit 750211
- 0 Bear Scratch Ln Unit 746695
- 0 Bear Scratch Ln Unit 745056
- 0 Bear Scratch Ln Unit 744685
- 0 Bear Scratch Ln Unit 744383
- 0 Bear Scratch Ln Unit 744347
- 0 Bear Scratch Ln Unit 740411
- 0 Bear Scratch Ln Unit 739924
- 0 Bear Scratch Ln Unit 2080
- 0 Bear Scratch Ln Unit 2987
- 0 Bear Scratch Ln Unit 3314
- 0 Bear Scratch Ln Unit 3462
- 0 Bear Scratch Ln Unit 3976
- 0 Bear Scratch Ln Unit 4223
- 0 Bear Scratch Ln Unit 4297
- 0 Bear Scratch Ln Unit 4508