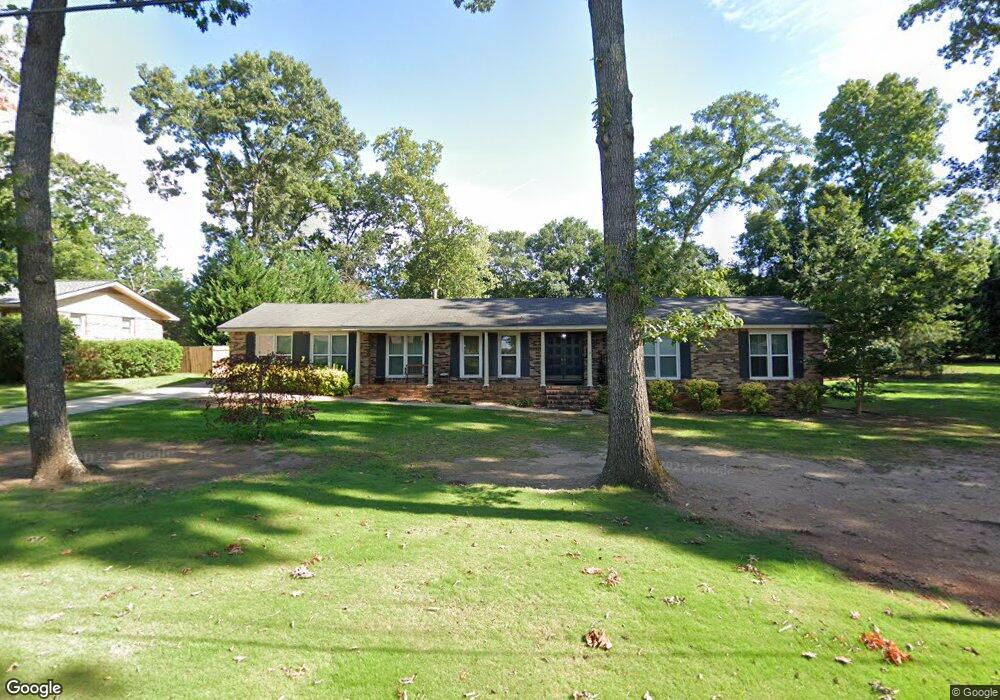
105 Bobolink Dr Griffin, GA 30224
Spalding County NeighborhoodEstimated Value: $225,000 - $263,000
4
Beds
3
Baths
1,759
Sq Ft
$137/Sq Ft
Est. Value
About This Home
This home is located at 105 Bobolink Dr, Griffin, GA 30224 and is currently estimated at $240,872, approximately $136 per square foot. 105 Bobolink Dr is a home located in Spalding County with nearby schools including Crescent Road Elementary School, Rehoboth Road Middle School, and Spalding High School.
Ownership History
Date
Name
Owned For
Owner Type
Purchase Details
Closed on
May 20, 2005
Sold by
Carroll Ken D
Bought by
Carroll Ken D and Carroll Marie
Current Estimated Value
Home Financials for this Owner
Home Financials are based on the most recent Mortgage that was taken out on this home.
Original Mortgage
$128,976
Outstanding Balance
$67,076
Interest Rate
5.8%
Mortgage Type
VA
Estimated Equity
$173,796
Purchase Details
Closed on
Jul 28, 2004
Sold by
Gulledge Richard T
Bought by
Colwell Nancy F
Purchase Details
Closed on
Mar 22, 2004
Sold by
Gulledge Charles R
Bought by
Gulledge Richard T
Purchase Details
Closed on
Jun 2, 1980
Sold by
Perkins Barbara Cofield
Bought by
Gulledge Richard
Purchase Details
Closed on
Sep 1, 1977
Sold by
Perkins David Eugene
Bought by
Perkins Barbara Cofield
Purchase Details
Closed on
Mar 1, 1973
Sold by
Murray George and William Simons
Bought by
Perkins David Eugene
Purchase Details
Closed on
Aug 7, 1970
Sold by
Fgs Enterprises
Bought by
Murray George and William Simons
Purchase Details
Closed on
Apr 4, 1970
Sold by
Addison George J and Freeman Ralph W
Bought by
Fgs Enterprises
Purchase Details
Closed on
Mar 21, 1968
Bought by
Addison George and Freeman Ralph W
Create a Home Valuation Report for This Property
The Home Valuation Report is an in-depth analysis detailing your home's value as well as a comparison with similar homes in the area
Home Values in the Area
Average Home Value in this Area
Purchase History
| Date | Buyer | Sale Price | Title Company |
|---|---|---|---|
| Carroll Ken D | -- | -- | |
| Carroll Ken D | $131,000 | -- | |
| Colwell Nancy F | $85,000 | -- | |
| Gulledge Richard T | -- | -- | |
| Gulledge Richard | -- | -- | |
| Perkins Barbara Cofield | -- | -- | |
| Perkins David Eugene | $3,800 | -- | |
| Murray George | $62,800 | -- | |
| Fgs Enterprises | $52,700 | -- | |
| Addison George | -- | -- |
Source: Public Records
Mortgage History
| Date | Status | Borrower | Loan Amount |
|---|---|---|---|
| Open | Carroll Ken D | $128,976 |
Source: Public Records
Tax History Compared to Growth
Tax History
| Year | Tax Paid | Tax Assessment Tax Assessment Total Assessment is a certain percentage of the fair market value that is determined by local assessors to be the total taxable value of land and additions on the property. | Land | Improvement |
|---|---|---|---|---|
| 2024 | $1,515 | $66,017 | $9,200 | $56,817 |
| 2023 | $1,515 | $61,446 | $9,200 | $52,246 |
| 2022 | $1,584 | $59,052 | $8,000 | $51,052 |
| 2021 | $1,224 | $47,311 | $8,000 | $39,311 |
| 2020 | $1,027 | $41,756 | $8,000 | $33,756 |
| 2019 | $1,125 | $41,756 | $8,000 | $33,756 |
| 2018 | $1,260 | $38,581 | $8,000 | $30,581 |
| 2017 | $1,434 | $38,581 | $8,000 | $30,581 |
| 2016 | $1,518 | $40,110 | $8,000 | $32,110 |
| 2015 | $1,563 | $40,110 | $8,000 | $32,110 |
| 2014 | $1,594 | $40,110 | $8,000 | $32,110 |
Source: Public Records
Map
Nearby Homes
- 114 Maddox Rd
- 227 Brown Acres Rd
- 105 Jewel Dr
- 1801, 1831 & 19 Zebulon Rd
- 133 Coldwater Ln
- 115 Kline Cir
- 139 Coldwater Ln
- 1479 Gloria St
- 1473 Gloria St
- 1 Sweetbriar Ln Unit A
- 36 Laurelwood Cir
- 145 Coldwater Way
- 1491 Wesley Dr
- 7 Crabapple Cir
- 0 Martin Luther King jr Pkwy Unit 19-41 BYPASS HIGHWAY
- 0 Cedardale Dr Unit 10272855
- 1064 Cold Water Dr
- 1480 Wesley Dr
- TRACT D Cedardale Drive Sweetbriar Ln
- 0 Sweetbriar Ln Unit B 20110670
- 107 Bobolink Dr
- 103 Bobolink Dr
- 1317 Ethridge Mill Rd
- 101 Bobolink Dr
- 109 Bobolink Dr
- 106 Bobolink Dr
- 108 Bobolink Dr Unit B
- 108 Bobolink Dr
- 108 Bobolink Dr Unit B
- 1315 Ethridge Mill Rd
- 108 Brice St
- 104 Bobolink Dr
- 0 Ethridge Mill Rd Unit 3107019
- 0 Ethridge Mill Rd Unit 7306419
- 0 Ethridge Mill Rd Unit 8985369
- 0 Ethridge Mill Rd Unit 8977501
- 0 Ethridge Mill Rd Unit 9078799
- 0 Ethridge Mill Rd Unit 9063981
- 0 Ethridge Mill Rd Unit 8769438
- 0 Ethridge Mill Rd Unit 8826196