Estimated Value: $260,721 - $304,000
3
Beds
3
Baths
1,840
Sq Ft
$153/Sq Ft
Est. Value
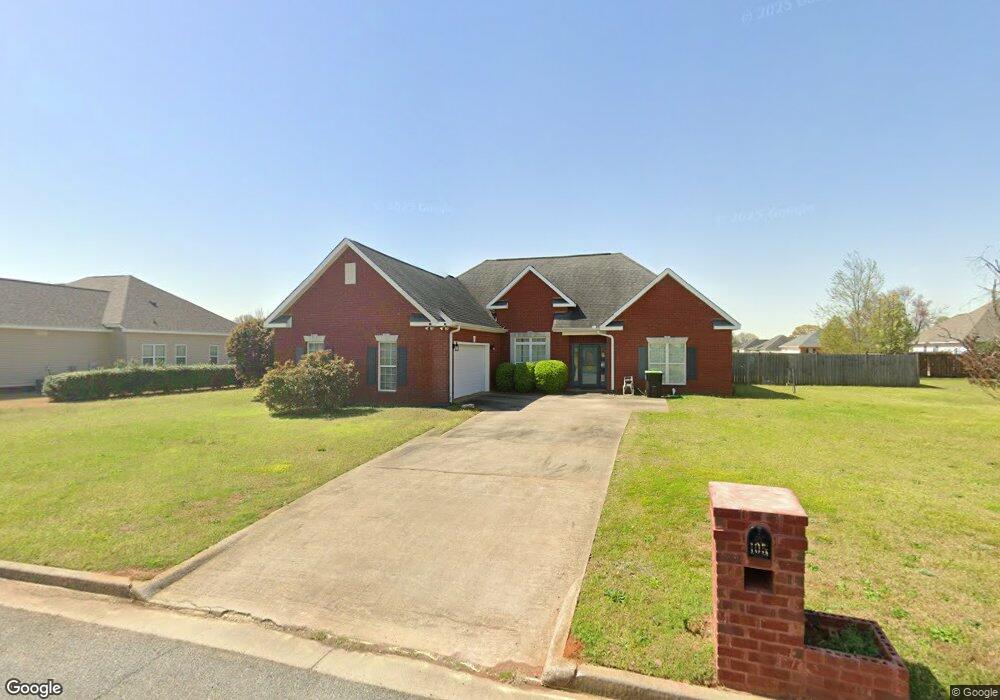
About This Home
This home is located at 105 Brandon Way, Byron, GA 31008 and is currently estimated at $282,361, approximately $153 per square foot. 105 Brandon Way is a home located in Peach County with nearby schools including Kay Road Elementary School, Fort Valley Middle School, and Peach County High School.
Ownership History
Date
Name
Owned For
Owner Type
Purchase Details
Closed on
Nov 12, 2010
Sold by
Branch Banking & Trust Company
Bought by
Flanders Christy L
Current Estimated Value
Home Financials for this Owner
Home Financials are based on the most recent Mortgage that was taken out on this home.
Original Mortgage
$134,714
Outstanding Balance
$88,565
Interest Rate
4.2%
Mortgage Type
New Conventional
Estimated Equity
$193,796
Purchase Details
Closed on
Oct 6, 2009
Sold by
Branch Banking & Trust Company
Bought by
Branch Banking & Trust Company
Purchase Details
Closed on
Sep 20, 2005
Sold by
Sunbrook Homes Llc
Bought by
Casma Homes Llc
Purchase Details
Closed on
Aug 26, 2005
Sold by
Cottonwood Land Corporation
Bought by
Sunbrook Homes Llc
Purchase Details
Closed on
Jun 3, 2003
Bought by
Cottonwood Land Corporation
Create a Home Valuation Report for This Property
The Home Valuation Report is an in-depth analysis detailing your home's value as well as a comparison with similar homes in the area
Home Values in the Area
Average Home Value in this Area
Purchase History
| Date | Buyer | Sale Price | Title Company |
|---|---|---|---|
| Flanders Christy L | $130,000 | -- | |
| Branch Banking & Trust Company | $230,000 | -- | |
| Casma Homes Llc | $112,000 | -- | |
| Sunbrook Homes Llc | -- | -- | |
| Cottonwood Land Corporation | -- | -- |
Source: Public Records
Mortgage History
| Date | Status | Borrower | Loan Amount |
|---|---|---|---|
| Open | Flanders Christy L | $134,714 |
Source: Public Records
Tax History Compared to Growth
Tax History
| Year | Tax Paid | Tax Assessment Tax Assessment Total Assessment is a certain percentage of the fair market value that is determined by local assessors to be the total taxable value of land and additions on the property. | Land | Improvement |
|---|---|---|---|---|
| 2024 | $2,919 | $83,280 | $10,000 | $73,280 |
| 2023 | $2,896 | $82,120 | $10,000 | $72,120 |
| 2022 | $1,908 | $72,880 | $10,000 | $62,880 |
| 2021 | $1,905 | $61,000 | $10,000 | $51,000 |
| 2020 | $1,988 | $63,680 | $10,000 | $53,680 |
| 2019 | $1,949 | $62,120 | $10,000 | $52,120 |
| 2018 | $1,795 | $56,920 | $10,000 | $46,920 |
| 2017 | $1,804 | $56,920 | $10,000 | $46,920 |
| 2016 | $1,796 | $56,920 | $10,000 | $46,920 |
| 2015 | $1,872 | $59,240 | $10,000 | $49,240 |
| 2014 | $1,875 | $59,240 | $10,000 | $49,240 |
| 2013 | -- | $59,240 | $10,000 | $49,240 |
Source: Public Records
Map
Nearby Homes
- 199 Red Tail Cir
- 109 Red Tail Cir
- 107 Red Tail Cir
- 152 Hawks Ridge Trace
- 120 Hawks Place
- 120 Hawks Ridge Trace
- 127 Hawks Ridge Trace
- 117 Hawks Ridge Trace
- 127 Erin Ct
- 219 Rowland Cir
- 0 Housers Mill Rd Unit 5515996
- 0 Barker Rd Unit 243030
- 0 Barker Rd Unit 14258525
- 0 Barker Rd Unit 175053
- 24C Sterling Dr
- 800 John E Sullivan Rd
- 211 Serenity Ct
- L54&L82 Brandon Way
- Lot 54&82 Brandon Way
- 107 Brandon Way
- 103 Brandon Way
- 403 Brandon Way
- 405 Brandon Way
- 401 Brandon Way
- 106 Brandon Way
- 201 Brandon Way
- 102 Elizabeth Dr
- 102 Elizabeth Dr
- 407 Brandon Way
- 307 Brandon Way
- 104 Brandon Way
- 0 Brandon Way Unit 88 7467155
- 0 Brandon Way Unit 88
- 0 Brandon Way Unit 8648139
- 402 Brandon Way
- 200 Brandon Way
- 104 Elizabeth Dr