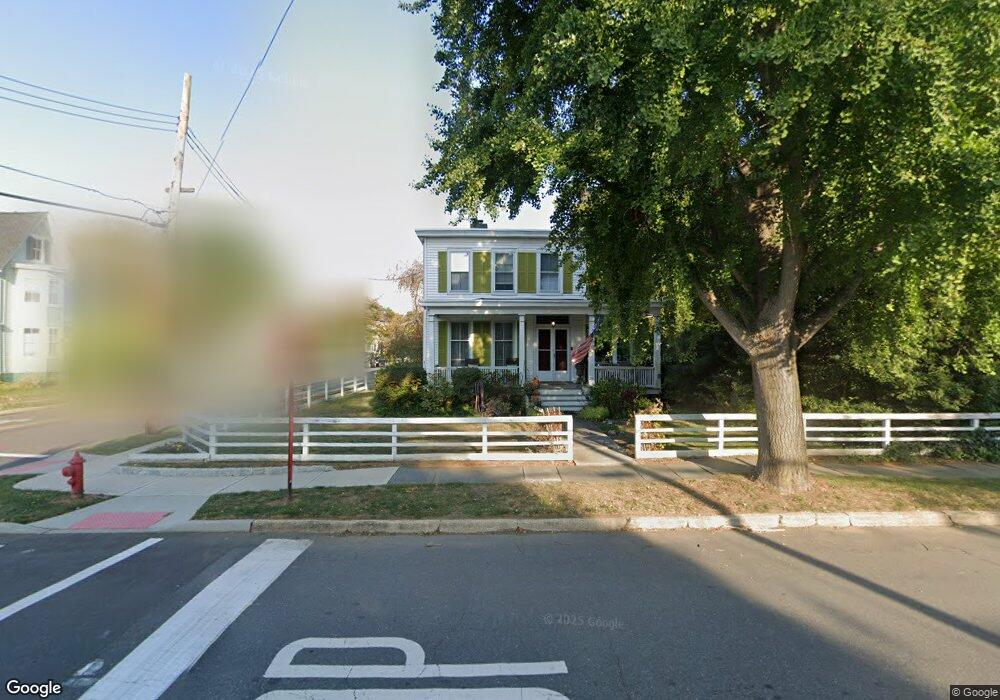
105 Broad St Freehold, NJ 07728
Estimated Value: $460,000 - $514,873
2
Beds
2
Baths
1,601
Sq Ft
$310/Sq Ft
Est. Value
About This Home
This home is located at 105 Broad St, Freehold, NJ 07728 and is currently estimated at $495,718, approximately $309 per square foot. 105 Broad St is a home located in Monmouth County with nearby schools including Park Avenue Elementary School, Freehold Intermediate School, and Freehold Borough High School.
Ownership History
Date
Name
Owned For
Owner Type
Purchase Details
Closed on
Feb 10, 2003
Sold by
Kenney Grant
Bought by
Janocha Roman and Levin Hillary
Current Estimated Value
Home Financials for this Owner
Home Financials are based on the most recent Mortgage that was taken out on this home.
Original Mortgage
$220,000
Interest Rate
5.86%
Purchase Details
Closed on
May 8, 1998
Sold by
Martz Christopher Wells
Bought by
Kenny Grant
Home Financials for this Owner
Home Financials are based on the most recent Mortgage that was taken out on this home.
Original Mortgage
$156,000
Interest Rate
7.08%
Mortgage Type
FHA
Create a Home Valuation Report for This Property
The Home Valuation Report is an in-depth analysis detailing your home's value as well as a comparison with similar homes in the area
Home Values in the Area
Average Home Value in this Area
Purchase History
| Date | Buyer | Sale Price | Title Company |
|---|---|---|---|
| Janocha Roman | $287,000 | -- | |
| Kenny Grant | $165,000 | -- |
Source: Public Records
Mortgage History
| Date | Status | Borrower | Loan Amount |
|---|---|---|---|
| Previous Owner | Janocha Roman | $220,000 | |
| Previous Owner | Kenny Grant | $156,000 |
Source: Public Records
Tax History Compared to Growth
Tax History
| Year | Tax Paid | Tax Assessment Tax Assessment Total Assessment is a certain percentage of the fair market value that is determined by local assessors to be the total taxable value of land and additions on the property. | Land | Improvement |
|---|---|---|---|---|
| 2025 | $8,751 | $517,900 | $303,900 | $214,000 |
| 2024 | $7,895 | $436,000 | $225,900 | $210,100 |
| 2023 | $7,895 | $376,500 | $171,300 | $205,200 |
| 2022 | $7,995 | $348,800 | $162,000 | $186,800 |
| 2021 | $7,995 | $304,800 | $135,000 | $169,800 |
| 2020 | $7,906 | $297,000 | $135,000 | $162,000 |
| 2019 | $7,741 | $292,100 | $135,000 | $157,100 |
| 2018 | $7,809 | $289,100 | $135,000 | $154,100 |
| 2017 | $7,786 | $287,100 | $135,000 | $152,100 |
| 2016 | $8,042 | $302,900 | $162,000 | $140,900 |
| 2015 | $8,360 | $329,900 | $189,000 | $140,900 |
| 2014 | $7,980 | $329,900 | $189,000 | $140,900 |
Source: Public Records
Map
Nearby Homes