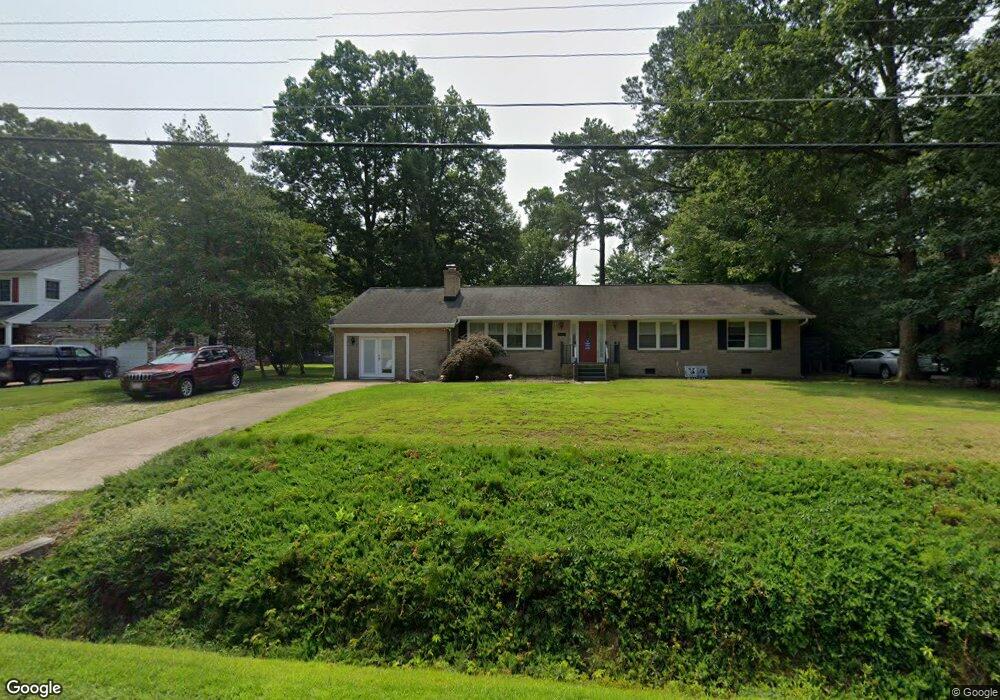
105 Brokenbridge Rd Yorktown, VA 23692
Estimated Value: $433,000 - $494,000
4
Beds
2
Baths
1,789
Sq Ft
$252/Sq Ft
Est. Value
About This Home
This home is located at 105 Brokenbridge Rd, Yorktown, VA 23692 and is currently estimated at $450,877, approximately $252 per square foot. 105 Brokenbridge Rd is a home located in York County with nearby schools including Yorktown Elementary School, Yorktown Middle School, and York High School.
Ownership History
Date
Name
Owned For
Owner Type
Purchase Details
Closed on
Aug 30, 2010
Sold by
Bogue William L
Bought by
Waers David
Current Estimated Value
Home Financials for this Owner
Home Financials are based on the most recent Mortgage that was taken out on this home.
Original Mortgage
$328,575
Outstanding Balance
$217,628
Interest Rate
4.5%
Mortgage Type
FHA
Estimated Equity
$233,249
Purchase Details
Closed on
Apr 15, 2009
Sold by
Westmoreland Larry E
Bought by
Bogue William L
Home Financials for this Owner
Home Financials are based on the most recent Mortgage that was taken out on this home.
Original Mortgage
$326,968
Interest Rate
4.93%
Mortgage Type
FHA
Purchase Details
Closed on
Jul 7, 2000
Sold by
Drumheller E Oakley
Bought by
Westmoreland Larry E
Home Financials for this Owner
Home Financials are based on the most recent Mortgage that was taken out on this home.
Original Mortgage
$149,900
Interest Rate
8.55%
Create a Home Valuation Report for This Property
The Home Valuation Report is an in-depth analysis detailing your home's value as well as a comparison with similar homes in the area
Home Values in the Area
Average Home Value in this Area
Purchase History
| Date | Buyer | Sale Price | Title Company |
|---|---|---|---|
| Waers David | $333,000 | -- | |
| Bogue William L | $333,000 | -- | |
| Westmoreland Larry E | $147,000 | -- |
Source: Public Records
Mortgage History
| Date | Status | Borrower | Loan Amount |
|---|---|---|---|
| Open | Waers David | $328,575 | |
| Previous Owner | Bogue William L | $326,968 | |
| Previous Owner | Westmoreland Larry E | $149,900 |
Source: Public Records
Tax History Compared to Growth
Tax History
| Year | Tax Paid | Tax Assessment Tax Assessment Total Assessment is a certain percentage of the fair market value that is determined by local assessors to be the total taxable value of land and additions on the property. | Land | Improvement |
|---|---|---|---|---|
| 2025 | $2,711 | $366,300 | $118,100 | $248,200 |
| 2024 | $2,711 | $366,300 | $118,100 | $248,200 |
| 2023 | $2,652 | $344,400 | $118,100 | $226,300 |
| 2022 | $2,708 | $347,200 | $118,100 | $229,100 |
| 2021 | $2,684 | $337,600 | $115,000 | $222,600 |
| 2020 | $2,684 | $337,600 | $115,000 | $222,600 |
| 2019 | $3,655 | $320,600 | $115,000 | $205,600 |
| 2018 | $3,655 | $320,600 | $115,000 | $205,600 |
| 2017 | $2,392 | $318,300 | $115,000 | $203,300 |
| 2016 | -- | $318,300 | $115,000 | $203,300 |
| 2015 | -- | $318,300 | $115,000 | $203,300 |
| 2014 | -- | $318,300 | $115,000 | $203,300 |
Source: Public Records
Map
Nearby Homes
- 107 Brokenbridge Rd
- 104 Harris Grove Ln
- 111 Ellery St
- 501 Fleming Way
- 115 Peyton Randolph Dr
- 112 Peyton Randolph Dr
- 508 Fleming Way
- 212 Manchester Way
- 106 Cypress Crossing
- 108 Farmstead Place
- 105 Farmstead Place
- 110 Briarwood Place
- 136 Briarwood Place
- 201 Allen Harris Dr
- 128 Ellis Dr
- 7 Bracewell Ln
- 6 Bracewell Ln
- 4 Bracewell Ln
- The Poplar II Plan at Yorktown Crescent
- 103 Daybeacon St
- 103 Brokenbridge Rd
- 109 Brokenbridge Rd
- 101 Brokenbridge Rd
- 104 Brokenbridge Rd
- 102 Brokenbridge Rd
- 100 Arcadia Loop
- 201 Brokenbridge Rd
- 100 Grafton District Rd
- 100 Brokenbridge Rd
- 203 Brokenbridge Rd
- 207 Cockletown Rd
- 101 Grafton District Rd
- 301 Cockletown Rd
- 104 Grafton District Rd
- 205 Brokenbridge Rd
- 205 Cockletown Rd
- 202 Brokenbridge Rd
- 99 Brokenbridge Rd
- 303 Cockletown Rd
- 203 Cockletown Rd