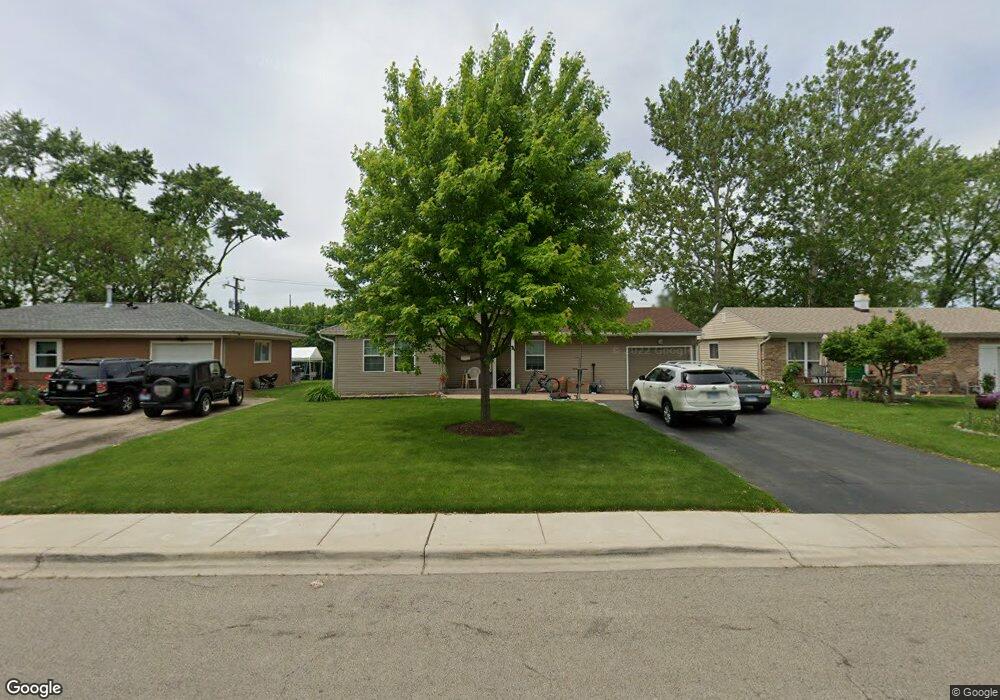
105 Caddy Ave Carpentersville, IL 60110
Estimated Value: $231,000 - $274,867
4
Beds
1
Bath
1,400
Sq Ft
$181/Sq Ft
Est. Value
About This Home
This home is located at 105 Caddy Ave, Carpentersville, IL 60110 and is currently estimated at $253,217, approximately $180 per square foot. 105 Caddy Ave is a home located in Kane County with nearby schools including Meadowdale Elementary School, Carpentersville Middle School, and Dundee-Crown High School.
Ownership History
Date
Name
Owned For
Owner Type
Purchase Details
Closed on
May 15, 2012
Sold by
Perez Uliese
Bought by
Alvarez Pedro Mata De and Mata Ana R Mendoza De
Current Estimated Value
Home Financials for this Owner
Home Financials are based on the most recent Mortgage that was taken out on this home.
Original Mortgage
$45,000
Interest Rate
3.92%
Mortgage Type
Purchase Money Mortgage
Purchase Details
Closed on
Sep 19, 2011
Sold by
Federal Home Loan Mortgage Corporation
Bought by
Perez Ulises
Purchase Details
Closed on
May 9, 2011
Sold by
Laskey Leo J
Bought by
Federal Home Loan Mortgage Corp
Purchase Details
Closed on
May 1, 1999
Sold by
Laskey Barbara A
Bought by
Laskey Leo J
Home Financials for this Owner
Home Financials are based on the most recent Mortgage that was taken out on this home.
Original Mortgage
$83,000
Interest Rate
7.04%
Create a Home Valuation Report for This Property
The Home Valuation Report is an in-depth analysis detailing your home's value as well as a comparison with similar homes in the area
Home Values in the Area
Average Home Value in this Area
Purchase History
| Date | Buyer | Sale Price | Title Company |
|---|---|---|---|
| Alvarez Pedro Mata De | $85,000 | Chicago Title Insurance Comp | |
| Dealvarez Pedro Mata | $85,000 | Chicago Title Insurance Co | |
| Perez Ulises | $32,000 | Attorneys Title Guaranty Fun | |
| Federal Home Loan Mortgage Corp | -- | None Available | |
| Laskey Leo J | -- | -- |
Source: Public Records
Mortgage History
| Date | Status | Borrower | Loan Amount |
|---|---|---|---|
| Previous Owner | Dealvarez Pedro Mata | $45,000 | |
| Previous Owner | Laskey Leo J | $83,000 |
Source: Public Records
Tax History Compared to Growth
Tax History
| Year | Tax Paid | Tax Assessment Tax Assessment Total Assessment is a certain percentage of the fair market value that is determined by local assessors to be the total taxable value of land and additions on the property. | Land | Improvement |
|---|---|---|---|---|
| 2024 | $4,862 | $72,197 | $12,553 | $59,644 |
| 2023 | $4,786 | $64,961 | $11,295 | $53,666 |
| 2022 | $4,592 | $58,740 | $11,295 | $47,445 |
| 2021 | $4,481 | $55,462 | $10,665 | $44,797 |
| 2020 | $4,405 | $54,215 | $10,425 | $43,790 |
| 2019 | $4,302 | $51,467 | $9,897 | $41,570 |
| 2018 | $3,748 | $43,764 | $9,701 | $34,063 |
| 2017 | $3,584 | $40,939 | $9,075 | $31,864 |
| 2016 | $3,210 | $35,180 | $8,787 | $26,393 |
| 2015 | -- | $29,254 | $8,234 | $21,020 |
| 2014 | -- | $24,668 | $8,007 | $16,661 |
| 2013 | -- | $25,423 | $8,252 | $17,171 |
Source: Public Records
Map
Nearby Homes
- 7 Hickory Dr
- 1105 Denver Dr
- 4 Austin Ave
- 34 Hickory Dr
- 57 Robin Rd
- 7 Austin Ave
- 51 Golfview Ln
- 901 Garfield Dr
- 512 Tyler Dr
- 1000 Adams Ct
- 181 Skyline Dr
- 1040 Rosewood Dr
- Lot 6B Ravine Rd
- Lot 6A Ravine Rd
- Lot 6 Ravine Rd
- 1505 Plymouth Cir
- 730 Council Hill Rd
- 494 Rosewood Dr
- 1033 Rosewood Dr
- 135 Indian Ln