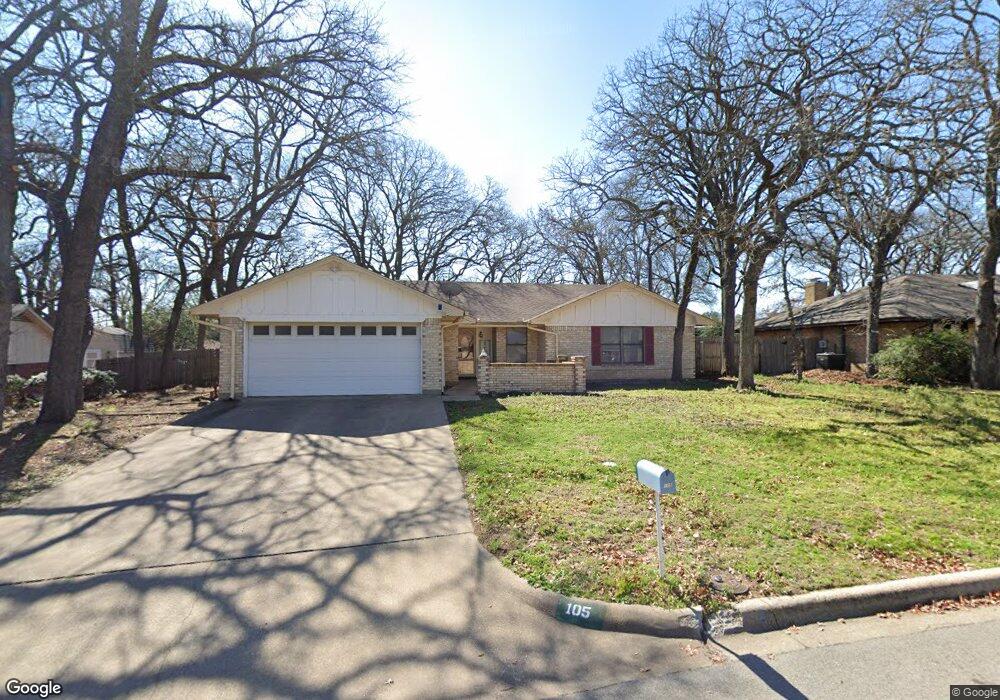
105 Camelot Dr Weatherford, TX 76086
Estimated Value: $290,000 - $314,000
3
Beds
2
Baths
1,687
Sq Ft
$179/Sq Ft
Est. Value
About This Home
This home is located at 105 Camelot Dr, Weatherford, TX 76086 and is currently estimated at $302,204, approximately $179 per square foot. 105 Camelot Dr is a home located in Parker County with nearby schools including Austin Elementary School, Hall Middle School, and Weatherford High School.
Ownership History
Date
Name
Owned For
Owner Type
Purchase Details
Closed on
Mar 9, 2015
Sold by
Six Justin N and Six Hayley
Bought by
Arellano Andrea M and Arellano Adolfo M
Current Estimated Value
Home Financials for this Owner
Home Financials are based on the most recent Mortgage that was taken out on this home.
Original Mortgage
$137,464
Outstanding Balance
$107,454
Interest Rate
4.25%
Mortgage Type
FHA
Estimated Equity
$194,750
Purchase Details
Closed on
May 3, 2006
Sold by
Mahoney Patti J
Bought by
Arellano Andrea M and Arellano Adolfo M
Home Financials for this Owner
Home Financials are based on the most recent Mortgage that was taken out on this home.
Original Mortgage
$121,250
Interest Rate
6.32%
Mortgage Type
New Conventional
Purchase Details
Closed on
Nov 18, 1994
Bought by
Arellano Andrea M and Arellano Adolfo M
Purchase Details
Closed on
Jun 3, 1985
Bought by
Arellano Andrea M and Arellano Adolfo M
Create a Home Valuation Report for This Property
The Home Valuation Report is an in-depth analysis detailing your home's value as well as a comparison with similar homes in the area
Home Values in the Area
Average Home Value in this Area
Purchase History
| Date | Buyer | Sale Price | Title Company |
|---|---|---|---|
| Arellano Andrea M | -- | Providence Title Company | |
| Arellano Andrea M | -- | -- | |
| Six Justin N | -- | Stnt | |
| Arellano Andrea M | -- | -- | |
| Arellano Andrea M | -- | -- |
Source: Public Records
Mortgage History
| Date | Status | Borrower | Loan Amount |
|---|---|---|---|
| Open | Arellano Andrea M | $137,464 | |
| Previous Owner | Six Justin N | $121,250 |
Source: Public Records
Tax History Compared to Growth
Tax History
| Year | Tax Paid | Tax Assessment Tax Assessment Total Assessment is a certain percentage of the fair market value that is determined by local assessors to be the total taxable value of land and additions on the property. | Land | Improvement |
|---|---|---|---|---|
| 2025 | $3,916 | $282,540 | $50,000 | $232,540 |
| 2024 | $3,916 | $256,927 | -- | -- |
| 2023 | $3,916 | $233,570 | $0 | $0 |
| 2022 | $4,710 | $212,340 | $25,000 | $187,340 |
| 2021 | $4,794 | $212,340 | $25,000 | $187,340 |
| 2020 | $4,385 | $181,480 | $25,000 | $156,480 |
| 2019 | $4,228 | $181,480 | $25,000 | $156,480 |
| 2018 | $3,861 | $150,520 | $20,000 | $130,520 |
| 2017 | $3,937 | $150,520 | $20,000 | $130,520 |
| 2016 | $3,579 | $136,020 | $20,000 | $116,020 |
| 2015 | $3,505 | $136,020 | $20,000 | $116,020 |
| 2014 | $2,839 | $113,040 | $20,000 | $93,040 |
Source: Public Records
Map
Nearby Homes
- 101 Black Forest Dr
- 118 Black Forest Dr
- 128 Black Forest Dr
- 2001 Santa fe Dr
- 207 Camelot Dr
- 1628 Holland Lake Dr
- 2004 Hill Crest Ct
- 2202 Lakeforest Dr
- 1209 Timber Creek Dr
- 1421 Highlake Ln
- 2116 Clear Lake Rd
- 1905 Clear Creek Dr
- 1017 Inverness Dr
- 905 Terry Trail
- 1234 Newcastle Dr
- 1029 Inverness Dr
- 307 Hickory Ln
- 936 Eldorado St
- 934 Eldorado St
- 2214 Lake Country Dr
- 107 Camelot Dr
- 105 Guinevere Dr
- 107 Guinevere Dr
- 103 Camelot Dr
- 109 Guinevere Dr
- 106 Camelot Dr
- 108 Camelot Dr
- 111 Guinevere Dr
- 104 Camelot Dr
- 108 Briarhaven Blvd
- 113 Guinevere Dr
- 110 Camelot Dr
- 102 Camelot Dr
- 103 Guinevere Dr
- 112 Camelot Dr
- 108 Guinevere Dr
- 102 Guinevere Ct
- 101 Guinevere Dr
- 106 Guinevere Dr
- 107 Yorkshire Ct