Estimated Value: $314,298 - $342,000
4
Beds
2
Baths
1,679
Sq Ft
$192/Sq Ft
Est. Value
About This Home
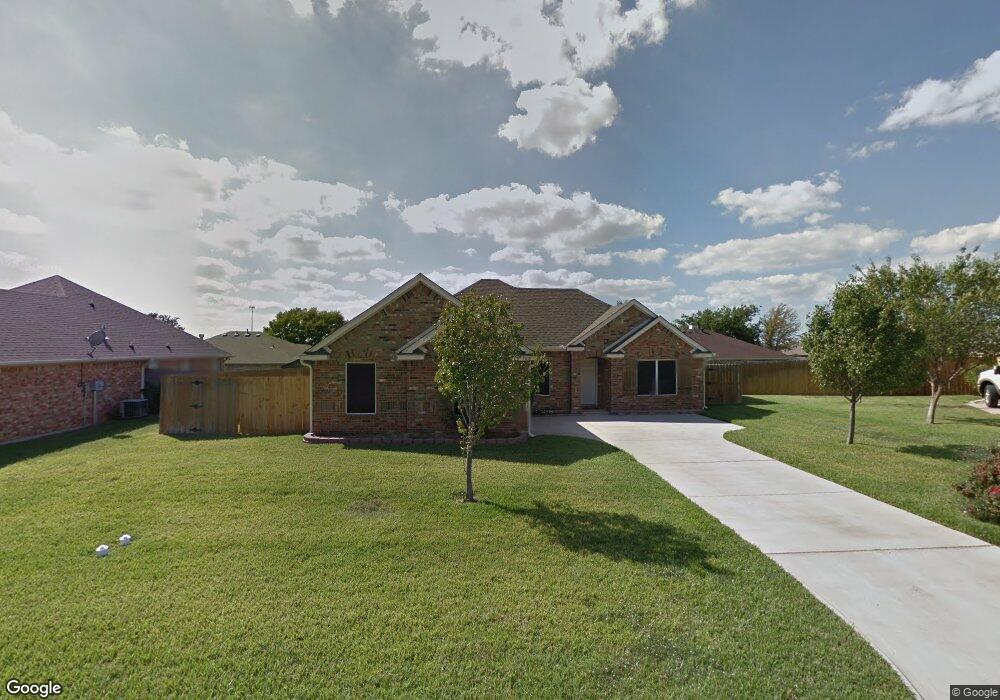
This home is located at 105 Carissa Ct, Krum, TX 76249 and is currently estimated at $322,325, approximately $191 per square foot. 105 Carissa Ct is a home located in Denton County with nearby schools including Krum Early Education Center, Blanche Dodd Intermediate School, and Krum Middle School.
Ownership History
Date
Name
Owned For
Owner Type
Purchase Details
Closed on
May 16, 2005
Sold by
Helal Jason R
Bought by
Jones Shirley
Current Estimated Value
Home Financials for this Owner
Home Financials are based on the most recent Mortgage that was taken out on this home.
Original Mortgage
$99,920
Outstanding Balance
$55,303
Interest Rate
6.81%
Mortgage Type
Fannie Mae Freddie Mac
Estimated Equity
$267,022
Purchase Details
Closed on
Oct 5, 2004
Sold by
Mill Bow Homes Inc
Bought by
Helal Jason R
Home Financials for this Owner
Home Financials are based on the most recent Mortgage that was taken out on this home.
Original Mortgage
$102,400
Interest Rate
5.74%
Mortgage Type
Purchase Money Mortgage
Create a Home Valuation Report for This Property
The Home Valuation Report is an in-depth analysis detailing your home's value as well as a comparison with similar homes in the area
Home Values in the Area
Average Home Value in this Area
Purchase History
| Date | Buyer | Sale Price | Title Company |
|---|---|---|---|
| Jones Shirley | -- | Reunion Title | |
| Helal Jason R | -- | Fatco |
Source: Public Records
Mortgage History
| Date | Status | Borrower | Loan Amount |
|---|---|---|---|
| Open | Jones Shirley | $99,920 | |
| Previous Owner | Helal Jason R | $102,400 | |
| Closed | Jones Shirley | $24,980 |
Source: Public Records
Tax History Compared to Growth
Tax History
| Year | Tax Paid | Tax Assessment Tax Assessment Total Assessment is a certain percentage of the fair market value that is determined by local assessors to be the total taxable value of land and additions on the property. | Land | Improvement |
|---|---|---|---|---|
| 2025 | $1,965 | $306,153 | $64,185 | $241,968 |
| 2024 | $5,969 | $296,221 | $0 | $0 |
| 2023 | $1,804 | $269,292 | $64,185 | $211,815 |
| 2022 | $5,615 | $244,811 | $64,185 | $232,505 |
| 2021 | $4,935 | $228,145 | $37,756 | $190,389 |
| 2020 | $4,582 | $202,323 | $37,756 | $164,567 |
| 2019 | $4,698 | $194,685 | $37,756 | $156,929 |
| 2018 | $4,371 | $180,235 | $37,756 | $142,479 |
| 2017 | $4,120 | $169,128 | $37,756 | $153,913 |
| 2016 | $2,720 | $153,753 | $37,756 | $129,792 |
| 2015 | $2,552 | $139,775 | $37,756 | $120,627 |
| 2014 | $2,552 | $127,068 | $26,429 | $100,639 |
| 2013 | -- | $134,416 | $26,429 | $107,987 |
Source: Public Records
Map
Nearby Homes