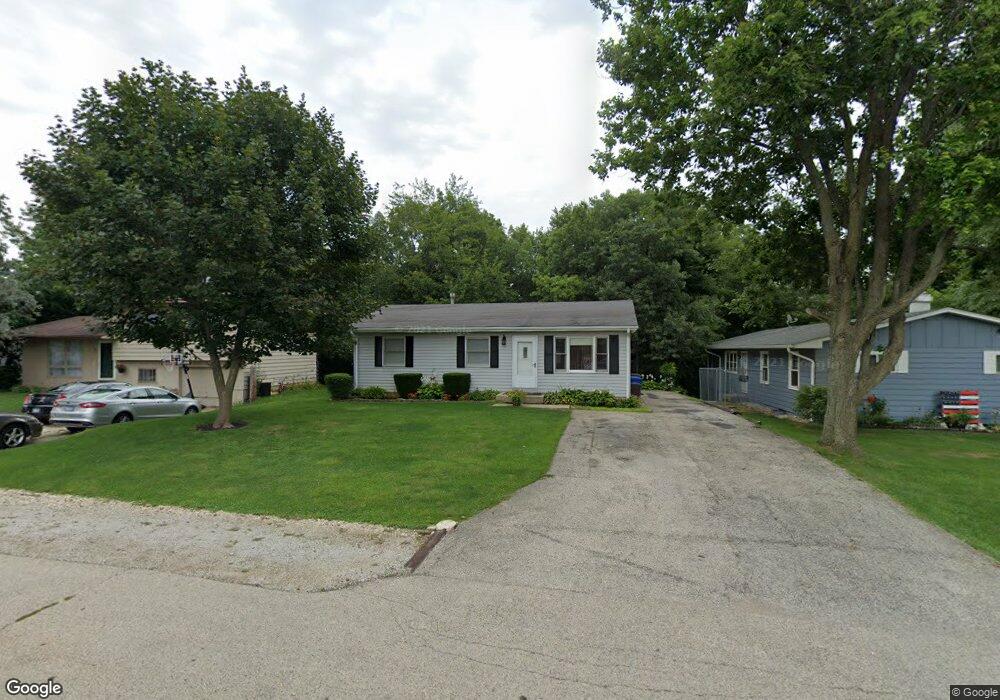
105 Castlewood Dr Carpentersville, IL 60110
Estimated Value: $233,587 - $299,000
3
Beds
--
Bath
912
Sq Ft
$294/Sq Ft
Est. Value
About This Home
This home is located at 105 Castlewood Dr, Carpentersville, IL 60110 and is currently estimated at $268,147, approximately $294 per square foot. 105 Castlewood Dr is a home located in Kane County with nearby schools including Parkview Elementary School, Crescent City Grade School, and Carpentersville Middle School.
Ownership History
Date
Name
Owned For
Owner Type
Purchase Details
Closed on
Sep 14, 2017
Sold by
Waite Clayton W
Bought by
Warner Brett W
Current Estimated Value
Home Financials for this Owner
Home Financials are based on the most recent Mortgage that was taken out on this home.
Original Mortgage
$112,917
Outstanding Balance
$95,773
Interest Rate
4.5%
Mortgage Type
FHA
Estimated Equity
$172,374
Purchase Details
Closed on
Dec 29, 2009
Sold by
Waite Clayton and Waite Christopher S
Bought by
Waite Clayton W and Clayton W Waite Jr Declaration Of Trust
Purchase Details
Closed on
Feb 17, 1997
Sold by
Waite Clayton and Waite Helen Ruth
Bought by
Waite Clayton W and Clayton W Waite Jr Declaration Of Trust
Create a Home Valuation Report for This Property
The Home Valuation Report is an in-depth analysis detailing your home's value as well as a comparison with similar homes in the area
Home Values in the Area
Average Home Value in this Area
Purchase History
| Date | Buyer | Sale Price | Title Company |
|---|---|---|---|
| Warner Brett W | $115,000 | Attorneys Title Guaranty Fun | |
| Waite Clayton W | -- | None Available | |
| Waite Clayton W | -- | None Available | |
| Waite Clayton W | -- | -- |
Source: Public Records
Mortgage History
| Date | Status | Borrower | Loan Amount |
|---|---|---|---|
| Open | Warner Brett W | $112,917 |
Source: Public Records
Tax History Compared to Growth
Tax History
| Year | Tax Paid | Tax Assessment Tax Assessment Total Assessment is a certain percentage of the fair market value that is determined by local assessors to be the total taxable value of land and additions on the property. | Land | Improvement |
|---|---|---|---|---|
| 2024 | $4,313 | $67,992 | $12,709 | $55,283 |
| 2023 | $3,999 | $61,177 | $11,435 | $49,742 |
| 2022 | $4,158 | $59,261 | $11,435 | $47,826 |
| 2021 | $4,018 | $55,954 | $10,797 | $45,157 |
| 2020 | $3,930 | $54,696 | $10,554 | $44,142 |
| 2019 | $3,804 | $51,923 | $10,019 | $41,904 |
| 2018 | $3,505 | $47,130 | $9,821 | $37,309 |
| 2017 | $3,860 | $44,088 | $9,187 | $34,901 |
| 2016 | $3,545 | $38,146 | $13,691 | $24,455 |
| 2015 | -- | $35,744 | $12,829 | $22,915 |
| 2014 | -- | $34,757 | $12,475 | $22,282 |
| 2013 | -- | $35,821 | $12,857 | $22,964 |
Source: Public Records
Map
Nearby Homes
- 171 Lake Shore Dr
- 181 Skyline Dr
- 105 Siesta Rd
- 149 Austin Ave
- 200 Amarillo Dr
- 308 Amarillo Ct
- 1426 Kings Rd
- 327 Tulsa Ave
- 494 Rosewood Dr
- 7 Austin Ave
- 1040 Rosewood Dr
- 140 Hickory Dr
- 1317 Brookdale Dr
- 4 Austin Ave
- 1431 Silverstone Dr Unit 1416
- 2013 Silverstone Dr Unit 2013
- 103 Hickory Dr
- 1244 Brookdale Dr
- 1309 Silverstone Dr Unit 1305
- 1303 Silverstone Dr Unit 1302
- 101 Castlewood Dr Unit 1
- 109 Castlewood Dr
- 93 Castlewood Dr
- 113 Castlewood Dr
- Lot 10 Castlewood Dr
- LOT 9 Castlewood Dr
- 288 Deerpath Ln
- 124 Castlewood Dr
- 282 Deerpath Ln
- 96 Castlewood Dr
- 286 Deerpath Ln
- 286 Deerpath Ln
- 89 Castlewood Dr
- 121 Kings Rd
- 280 Deerpath Ln
- 290 Deerpath Ln
- 292 Deerpath Ln Unit 1
- 119 Kings Rd
- Lot Castlewood Dr
- 294 Deerpath Ln