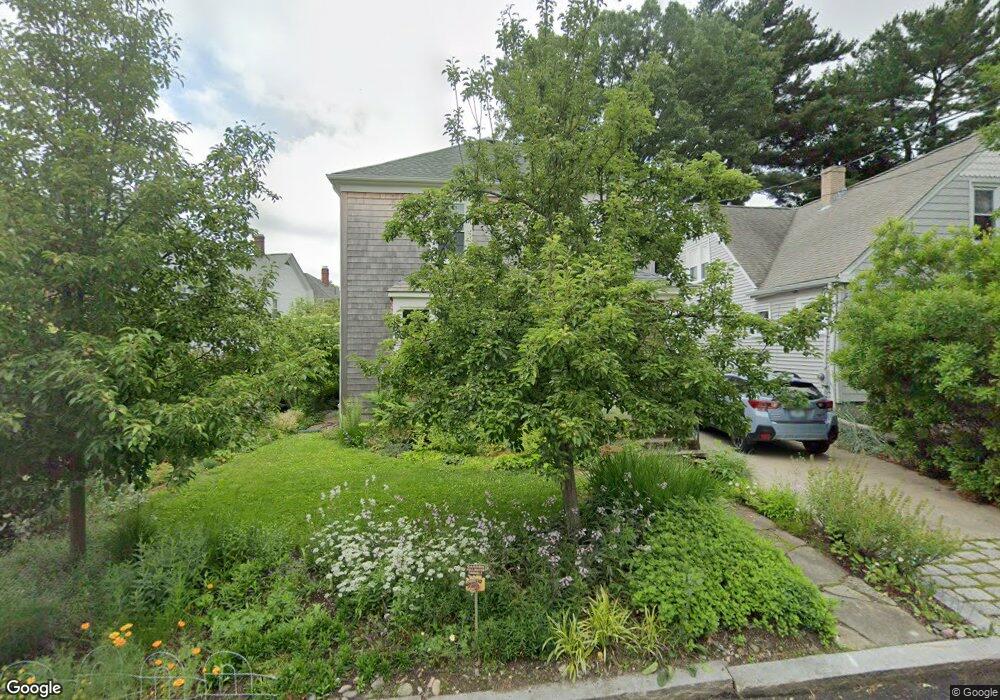
105 Chace Ave Providence, RI 02906
Hope NeighborhoodEstimated Value: $612,000 - $906,000
4
Beds
2
Baths
1,528
Sq Ft
$466/Sq Ft
Est. Value
About This Home
This home is located at 105 Chace Ave, Providence, RI 02906 and is currently estimated at $712,627, approximately $466 per square foot. 105 Chace Ave is a home located in Providence County with nearby schools including International Charter School, Blackstone Academy Charter School, and Jewish Community Day School Of Rhode Island.
Ownership History
Date
Name
Owned For
Owner Type
Purchase Details
Closed on
Sep 1, 2009
Sold by
Boobinder Joan Kay and Kearney Fredda
Bought by
Mcglynn Michael C
Current Estimated Value
Home Financials for this Owner
Home Financials are based on the most recent Mortgage that was taken out on this home.
Original Mortgage
$100,000
Interest Rate
5.17%
Mortgage Type
Purchase Money Mortgage
Create a Home Valuation Report for This Property
The Home Valuation Report is an in-depth analysis detailing your home's value as well as a comparison with similar homes in the area
Home Values in the Area
Average Home Value in this Area
Purchase History
| Date | Buyer | Sale Price | Title Company |
|---|---|---|---|
| Mcglynn Michael C | $280,000 | -- |
Source: Public Records
Mortgage History
| Date | Status | Borrower | Loan Amount |
|---|---|---|---|
| Open | Mcglynn Michael C | $81,004 | |
| Closed | Mcglynn Michael C | $97,200 | |
| Closed | Mcglynn Michael C | $100,000 |
Source: Public Records
Tax History
| Year | Tax Paid | Tax Assessment Tax Assessment Total Assessment is a certain percentage of the fair market value that is determined by local assessors to be the total taxable value of land and additions on the property. | Land | Improvement |
|---|---|---|---|---|
| 2025 | $4,980 | $592,800 | $368,700 | $224,100 |
| 2024 | $8,463 | $461,200 | $248,400 | $212,800 |
| 2023 | $8,463 | $461,200 | $248,400 | $212,800 |
| 2022 | $8,209 | $461,200 | $248,400 | $212,800 |
| 2021 | $7,557 | $307,700 | $193,700 | $114,000 |
| 2020 | $7,557 | $307,700 | $193,700 | $114,000 |
| 2019 | $7,427 | $302,400 | $193,700 | $108,700 |
| 2018 | $7,843 | $245,400 | $167,600 | $77,800 |
| 2017 | $7,843 | $245,400 | $167,600 | $77,800 |
| 2016 | $7,843 | $245,400 | $167,600 | $77,800 |
| 2015 | $7,583 | $229,100 | $156,500 | $72,600 |
| 2014 | $7,732 | $229,100 | $156,500 | $72,600 |
| 2013 | $7,732 | $229,100 | $156,500 | $72,600 |
Source: Public Records
Map
Nearby Homes
- 80 Hillside Ave
- 136 Hillside Ave
- 32 Carver St
- 6 Alfred Stone Rd
- 122 Lowden St
- 153 4th St
- 41 Campbell Terrace
- 5 Lowden St
- 62 Harwich Rd
- 39 Harwich Rd
- 540 Blackstone Blvd
- 89 Dexterdale Rd
- 152 Colonial Rd Unit 152
- 51 Wilcox Ave
- 18 Dunnell Ave
- 11 Sherman St
- 126 Dunnell Ave
- 103 Evergreen St
- 50 Batcheller Ave
- 71 Savoy St
Your Personal Tour Guide
Ask me questions while you tour the home.