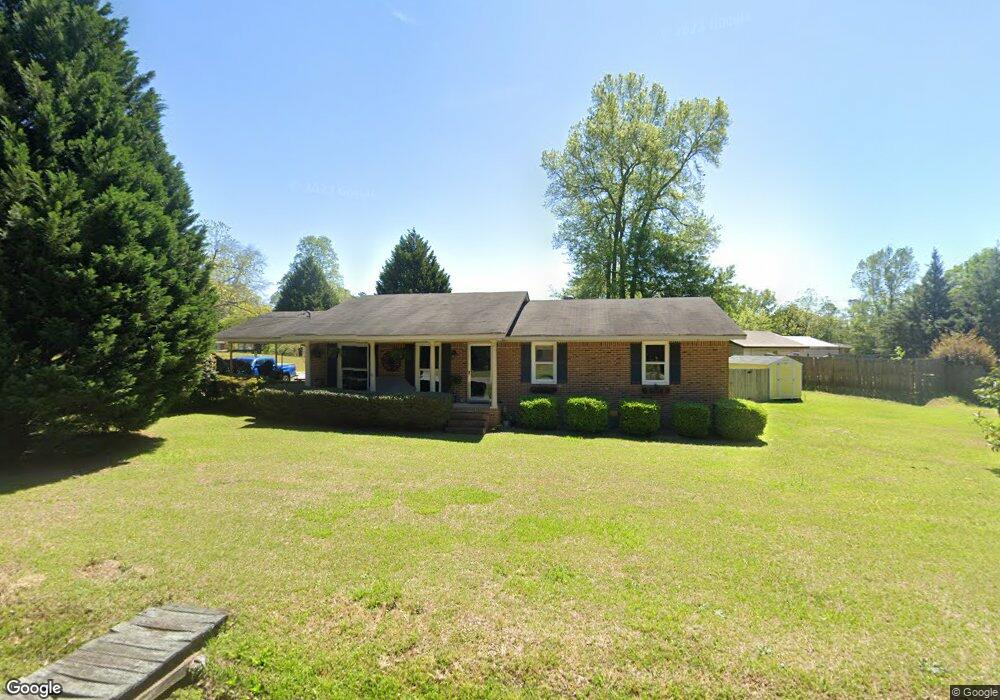
105 Cherokee Dr Barnesville, GA 30204
Estimated Value: $180,904 - $210,000
2
Beds
3
Baths
1,272
Sq Ft
$150/Sq Ft
Est. Value
About This Home
This home is located at 105 Cherokee Dr, Barnesville, GA 30204 and is currently estimated at $191,226, approximately $150 per square foot. 105 Cherokee Dr is a home located in Lamar County with nearby schools including Lamar County Primary School, Lamar County Elementary School, and Lamar County Middle School.
Ownership History
Date
Name
Owned For
Owner Type
Purchase Details
Closed on
Oct 26, 2018
Sold by
Hardy Helen W Estate
Bought by
Porter Ashley L
Current Estimated Value
Home Financials for this Owner
Home Financials are based on the most recent Mortgage that was taken out on this home.
Original Mortgage
$69,200
Outstanding Balance
$60,358
Interest Rate
4.7%
Mortgage Type
New Conventional
Estimated Equity
$130,868
Purchase Details
Closed on
Oct 15, 2012
Sold by
Porter Ashley Kerley
Bought by
Hardy Helen W
Purchase Details
Closed on
Oct 10, 2012
Sold by
Singletary Joanna H
Bought by
Hardy Helen W
Purchase Details
Closed on
Oct 8, 2012
Sold by
Kerley Robert Hudson
Bought by
Hardy Helen W
Purchase Details
Closed on
Sep 22, 2006
Sold by
Hardy Helen W
Bought by
Kerley Gaye H
Purchase Details
Closed on
Jan 6, 1967
Bought by
Hardy Helen W Mrs
Create a Home Valuation Report for This Property
The Home Valuation Report is an in-depth analysis detailing your home's value as well as a comparison with similar homes in the area
Home Values in the Area
Average Home Value in this Area
Purchase History
| Date | Buyer | Sale Price | Title Company |
|---|---|---|---|
| Porter Ashley L | $86,500 | -- | |
| Hardy Helen W | -- | -- | |
| Hardy Helen W | -- | -- | |
| Hardy Helen W | -- | -- | |
| Hardy Helen W | -- | -- | |
| Kerley Gaye H | -- | -- | |
| Hardy Helen W Mrs | -- | -- |
Source: Public Records
Mortgage History
| Date | Status | Borrower | Loan Amount |
|---|---|---|---|
| Open | Porter Ashley L | $69,200 |
Source: Public Records
Tax History
| Year | Tax Paid | Tax Assessment Tax Assessment Total Assessment is a certain percentage of the fair market value that is determined by local assessors to be the total taxable value of land and additions on the property. | Land | Improvement |
|---|---|---|---|---|
| 2025 | $2,116 | $78,960 | $6,000 | $72,960 |
| 2024 | $1,897 | $66,188 | $6,000 | $60,188 |
| 2023 | $1,862 | $60,316 | $6,000 | $54,316 |
| 2022 | $1,275 | $46,169 | $6,000 | $40,169 |
| 2021 | $1,121 | $37,273 | $6,000 | $31,273 |
| 2020 | $1,048 | $33,115 | $6,000 | $27,115 |
| 2019 | $1,051 | $33,115 | $6,000 | $27,115 |
| 2018 | $387 | $30,958 | $6,000 | $24,958 |
| 2017 | $405 | $30,958 | $6,000 | $24,958 |
| 2016 | $426 | $30,958 | $6,000 | $24,958 |
| 2015 | $468 | $31,762 | $6,804 | $24,958 |
| 2014 | $475 | $31,762 | $6,804 | $24,958 |
| 2013 | -- | $31,762 | $6,803 | $24,958 |
Source: Public Records
Map
Nearby Homes
- 209 Founders Dr
- 108 Bradley Cir
- 329 Pine St
- 503 Forsyth St
- 0 College Dr Unit 10632977
- 149 Holmes St
- 24 Sims St
- 147 Stafford Ave
- 114 Stafford Ave
- 0 Yatesville Rd Unit 10650403
- 0 Hannah Ct Unit LOT 13 10587187
- 0 Hannah Ct Unit LOT 10 10587183
- 0 Hannah Ct Unit LOT 14 10587190
- 0 Martin Luther King Junior Pkwy
- 0 Highway 341 S Unit 181569
- 0 Highway 341 S Unit 10610486
- 531 Thomaston St
- 0 Hannah St Unit LOT 1 10587177
- 1013 Veterans Pkwy
- 0 Us Highway 41
- 410 Gordon Rd
- 504 Gordon Rd
- 112 Cherokee Dr
- 100 Cherokee Dr
- 506 Gordon Rd
- 101 Honeysuckle Ln
- 101 Honeysuckle Ln
- 121 Cherokee Dr
- 100 Skyline Dr Unit 1,2
- 100 Skyline Dr
- 107 Honeysuckle Ln
- 209 Cherokee Dr
- 512 Gordon Rd
- 101 Skyline Dr
- 101 Skyline Dr
- 101 Skyline Dr
- 104 Redbud Dr
- 108 Skyline Dr
- 111 Honeysuckle Ln
- 118 Cherokee Dr
Your Personal Tour Guide
Ask me questions while you tour the home.