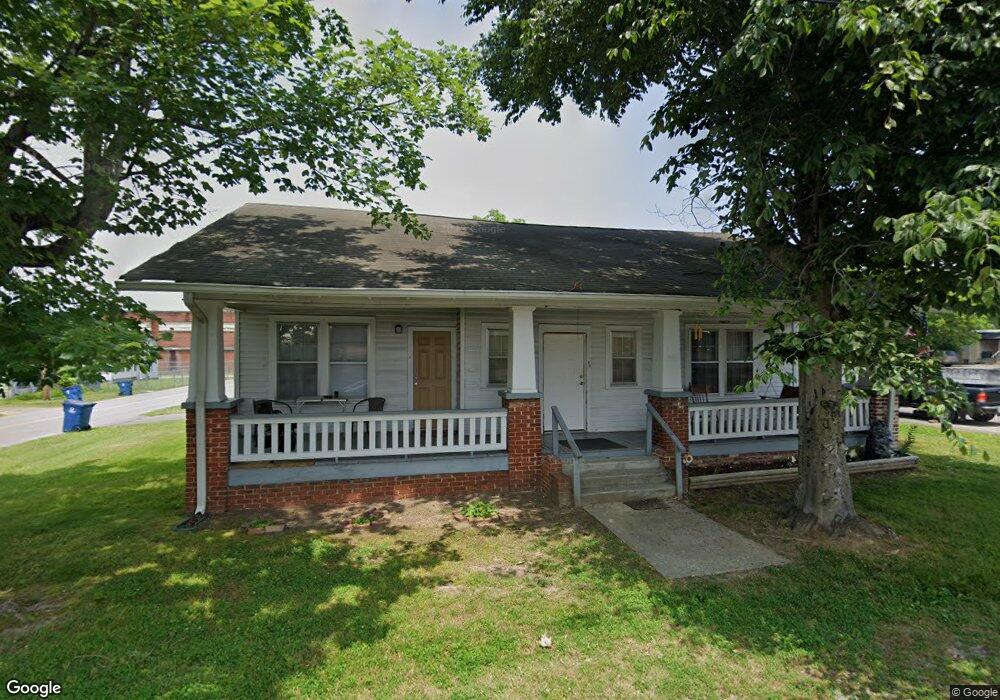
105 Cherry St Rossville, GA 30741
Estimated Value: $172,171 - $253,000
--
Bed
1
Bath
813
Sq Ft
$242/Sq Ft
Est. Value
About This Home
This home is located at 105 Cherry St, Rossville, GA 30741 and is currently estimated at $197,043, approximately $242 per square foot. 105 Cherry St is a home located in Walker County with nearby schools including Rossville Elementary School, Rossville Middle School, and Ridgeland High School.
Ownership History
Date
Name
Owned For
Owner Type
Purchase Details
Closed on
Apr 26, 2010
Sold by
Blevins Lena Ruth
Bought by
Cameron Donnie
Current Estimated Value
Home Financials for this Owner
Home Financials are based on the most recent Mortgage that was taken out on this home.
Original Mortgage
$79,318
Outstanding Balance
$53,007
Interest Rate
4.99%
Mortgage Type
New Conventional
Estimated Equity
$144,036
Purchase Details
Closed on
Nov 30, 2000
Sold by
Lena Blevins O and Lena Ruth
Bought by
Blevins Lena Ruth
Purchase Details
Closed on
Jan 1, 1972
Bought by
Lena Blevins O and Lena Ruth
Create a Home Valuation Report for This Property
The Home Valuation Report is an in-depth analysis detailing your home's value as well as a comparison with similar homes in the area
Home Values in the Area
Average Home Value in this Area
Purchase History
| Date | Buyer | Sale Price | Title Company |
|---|---|---|---|
| Cameron Donnie | $79,000 | -- | |
| Blevins Lena Ruth | -- | -- | |
| Lena Blevins O | -- | -- |
Source: Public Records
Mortgage History
| Date | Status | Borrower | Loan Amount |
|---|---|---|---|
| Open | Cameron Donnie | $79,318 |
Source: Public Records
Tax History Compared to Growth
Tax History
| Year | Tax Paid | Tax Assessment Tax Assessment Total Assessment is a certain percentage of the fair market value that is determined by local assessors to be the total taxable value of land and additions on the property. | Land | Improvement |
|---|---|---|---|---|
| 2024 | $3,138 | $96,128 | $4,750 | $91,378 |
| 2023 | $2,377 | $72,013 | $4,750 | $67,263 |
| 2022 | $1,649 | $62,656 | $4,750 | $57,906 |
| 2021 | $1,582 | $53,883 | $4,750 | $49,133 |
| 2020 | $1,390 | $45,323 | $4,750 | $40,573 |
| 2019 | $1,391 | $45,323 | $4,750 | $40,573 |
| 2018 | $1,348 | $45,323 | $4,750 | $40,573 |
| 2017 | $1,507 | $45,323 | $4,750 | $40,573 |
| 2016 | $1,250 | $45,323 | $4,750 | $40,573 |
| 2015 | $1,348 | $46,576 | $4,788 | $41,788 |
| 2014 | $1,298 | $46,576 | $4,788 | $41,788 |
| 2013 | -- | $46,576 | $4,788 | $41,788 |
Source: Public Records
Map
Nearby Homes