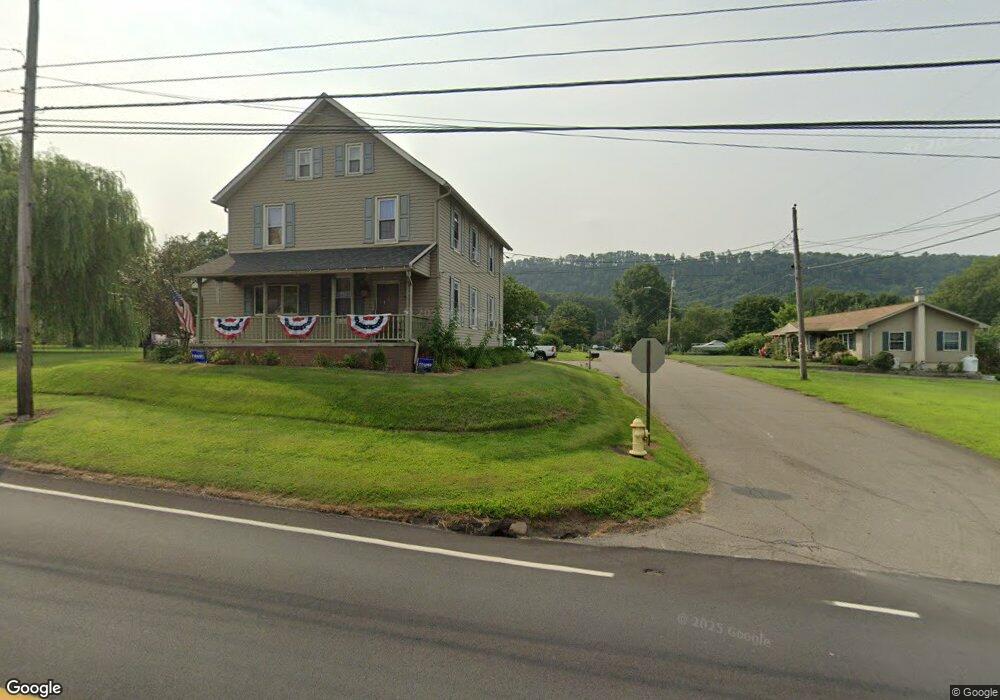
105 Chestnut St Nescopeck, PA 18635
Estimated Value: $155,107 - $233,000
--
Bed
--
Bath
1,263
Sq Ft
$151/Sq Ft
Est. Value
About This Home
This home is located at 105 Chestnut St, Nescopeck, PA 18635 and is currently estimated at $190,527, approximately $150 per square foot. 105 Chestnut St is a home located in Luzerne County with nearby schools including Berwick Area High School, Holy Family Consolidated School, and New Story School.
Ownership History
Date
Name
Owned For
Owner Type
Purchase Details
Closed on
Sep 14, 2020
Sold by
Jordan Douglas
Bought by
Walton Steven K and Walton Corey J
Current Estimated Value
Home Financials for this Owner
Home Financials are based on the most recent Mortgage that was taken out on this home.
Original Mortgage
$77,600
Outstanding Balance
$68,737
Interest Rate
2.8%
Mortgage Type
New Conventional
Estimated Equity
$121,790
Purchase Details
Closed on
Jun 7, 2016
Sold by
Jordan Douglas
Bought by
Jordan Douglas
Purchase Details
Closed on
Nov 22, 2010
Sold by
Jordan Ruth V
Bought by
Jordan Ruth and Jordan Douglas K
Create a Home Valuation Report for This Property
The Home Valuation Report is an in-depth analysis detailing your home's value as well as a comparison with similar homes in the area
Home Values in the Area
Average Home Value in this Area
Purchase History
| Date | Buyer | Sale Price | Title Company |
|---|---|---|---|
| Walton Steven K | $97,000 | None Available | |
| Jordan Douglas | -- | None Available | |
| Jordan Ruth | -- | None Available |
Source: Public Records
Mortgage History
| Date | Status | Borrower | Loan Amount |
|---|---|---|---|
| Open | Walton Steven K | $77,600 |
Source: Public Records
Tax History Compared to Growth
Tax History
| Year | Tax Paid | Tax Assessment Tax Assessment Total Assessment is a certain percentage of the fair market value that is determined by local assessors to be the total taxable value of land and additions on the property. | Land | Improvement |
|---|---|---|---|---|
| 2025 | $1,746 | $77,700 | $26,100 | $51,600 |
| 2024 | $1,693 | $77,700 | $26,100 | $51,600 |
| 2023 | $1,626 | $77,700 | $26,100 | $51,600 |
| 2022 | $1,611 | $77,700 | $26,100 | $51,600 |
| 2021 | $1,487 | $77,700 | $26,100 | $51,600 |
| 2020 | $1,442 | $77,700 | $26,100 | $51,600 |
| 2019 | $1,432 | $77,700 | $26,100 | $51,600 |
| 2018 | $1,422 | $77,700 | $26,100 | $51,600 |
| 2017 | $1,478 | $77,700 | $26,100 | $51,600 |
| 2016 | -- | $77,700 | $26,100 | $51,600 |
| 2015 | $1,136 | $77,700 | $26,100 | $51,600 |
| 2014 | $1,136 | $77,700 | $26,100 | $51,600 |
Source: Public Records
Map
Nearby Homes