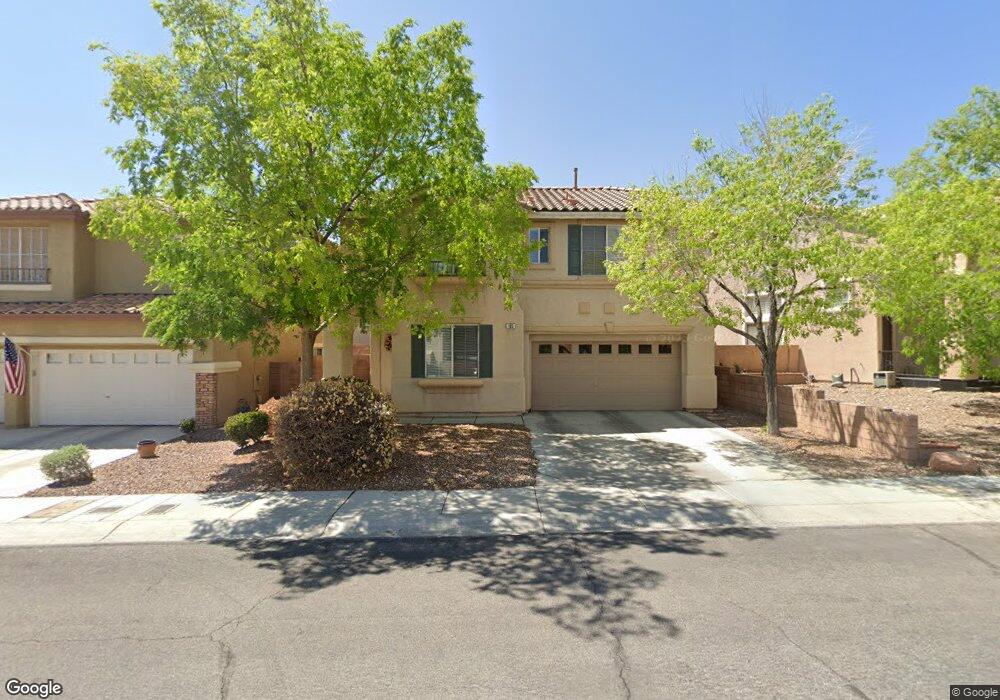
105 Clybourn Ct Las Vegas, NV 89144
Summerlin NeighborhoodEstimated Value: $552,557 - $628,000
3
Beds
3
Baths
1,970
Sq Ft
$303/Sq Ft
Est. Value
About This Home
This home is located at 105 Clybourn Ct, Las Vegas, NV 89144 and is currently estimated at $596,139, approximately $302 per square foot. 105 Clybourn Ct is a home located in Clark County with nearby schools including John W. Bonner Elementary School, Sig Rogich Middle School, and Palo Verde High School.
Ownership History
Date
Name
Owned For
Owner Type
Purchase Details
Closed on
Dec 29, 2022
Sold by
Mohanty Chandra S
Bought by
Mohanty Family Trust
Current Estimated Value
Purchase Details
Closed on
Jun 2, 2015
Sold by
Doak Dana L and Doak Susan A
Bought by
Mohanty Chandra S and Mohanty Sujata
Home Financials for this Owner
Home Financials are based on the most recent Mortgage that was taken out on this home.
Original Mortgage
$236,000
Interest Rate
3.62%
Mortgage Type
New Conventional
Purchase Details
Closed on
Jul 22, 2003
Sold by
Mcnair Hyonsuk Kim
Bought by
Doak Dana L and Doak Susan A
Home Financials for this Owner
Home Financials are based on the most recent Mortgage that was taken out on this home.
Original Mortgage
$190,480
Interest Rate
5.13%
Mortgage Type
Unknown
Purchase Details
Closed on
May 24, 2000
Sold by
Lewis Homes Carlyle Venture Llc
Bought by
Mcnair Hyonsuk Kim
Home Financials for this Owner
Home Financials are based on the most recent Mortgage that was taken out on this home.
Original Mortgage
$100,000
Interest Rate
8.18%
Create a Home Valuation Report for This Property
The Home Valuation Report is an in-depth analysis detailing your home's value as well as a comparison with similar homes in the area
Home Values in the Area
Average Home Value in this Area
Purchase History
| Date | Buyer | Sale Price | Title Company |
|---|---|---|---|
| Mohanty Family Trust | -- | -- | |
| Mohanty Chandra S | $295,000 | Driggs Title Agency Inc | |
| Doak Dana L | $238,100 | Ticor Title Of Nevada Inc | |
| Mcnair Hyonsuk Kim | $160,882 | First American Title Co |
Source: Public Records
Mortgage History
| Date | Status | Borrower | Loan Amount |
|---|---|---|---|
| Previous Owner | Mohanty Chandra S | $236,000 | |
| Previous Owner | Doak Dana L | $190,480 | |
| Previous Owner | Mcnair Hyonsuk Kim | $100,000 |
Source: Public Records
Tax History Compared to Growth
Tax History
| Year | Tax Paid | Tax Assessment Tax Assessment Total Assessment is a certain percentage of the fair market value that is determined by local assessors to be the total taxable value of land and additions on the property. | Land | Improvement |
|---|---|---|---|---|
| 2025 | $3,294 | $132,449 | $59,850 | $72,599 |
| 2024 | $3,051 | $132,449 | $59,850 | $72,599 |
| 2023 | $3,051 | $111,835 | $43,050 | $68,785 |
| 2022 | $2,825 | $96,863 | $33,950 | $62,913 |
| 2021 | $2,616 | $92,106 | $32,200 | $59,906 |
| 2020 | $2,426 | $91,529 | $32,200 | $59,329 |
| 2019 | $2,274 | $87,754 | $29,400 | $58,354 |
| 2018 | $2,170 | $78,832 | $22,750 | $56,082 |
| 2017 | $2,575 | $78,370 | $21,700 | $56,670 |
| 2016 | $2,031 | $74,043 | $17,150 | $56,893 |
| 2015 | $2,027 | $69,395 | $13,300 | $56,095 |
| 2014 | $1,964 | $59,662 | $10,500 | $49,162 |
Source: Public Records
Map
Nearby Homes
- 101 Clybourn Ct
- 10765 Turquoise Valley Dr
- 10716 Aire Dr
- 205 Derwent Place
- 10624 Tyne Place
- 161 Swale Ln
- 340 Autumn Palace Ct
- 10665 Sapphire Vista Ave
- 10680 Sapphire Vista Ave
- 10661 Sapphire Vista Ave
- 421 Silver Prairie Ct
- 10665 Blue Nile Ct
- 10657 Blue Nile Ct
- 10452 Niagara Falls Ln
- 552 Jade Cliffs Ln
- 10553 Pine Pointe Ave Unit 201
- 353 Amber Pine St Unit 203
- 400 Amber Pine St Unit 203
- 10504 Narra Place
- 10524 Pine Gardens Ct Unit 203
- 105 Clybourn Ct
- 105 Clybourn Ct
- 109 Clybourn Ct
- 10752 Turquoise Valley Dr
- 10752 Turquoise Valley Dr Unit n/a
- 121 Clybourn Ct
- 10756 Turquoise Valley Dr
- 10732 Turquoise Valley Dr
- 141 Clybourn Ct
- 108 Clybourn Ct
- 125 Clybourn Ct
- 112 Clybourn Ct
- 10760 Turquoise Valley Dr
- 10745 Turquoise Valley Dr
- 145 Clybourn Ct
- 10741 Turquoise Valley Dr
- 10728 Turquoise Valley Dr
- 116 Clybourn Ct
- 10753 Turquoise Valley Dr
- 10737 Turquoise Valley Dr