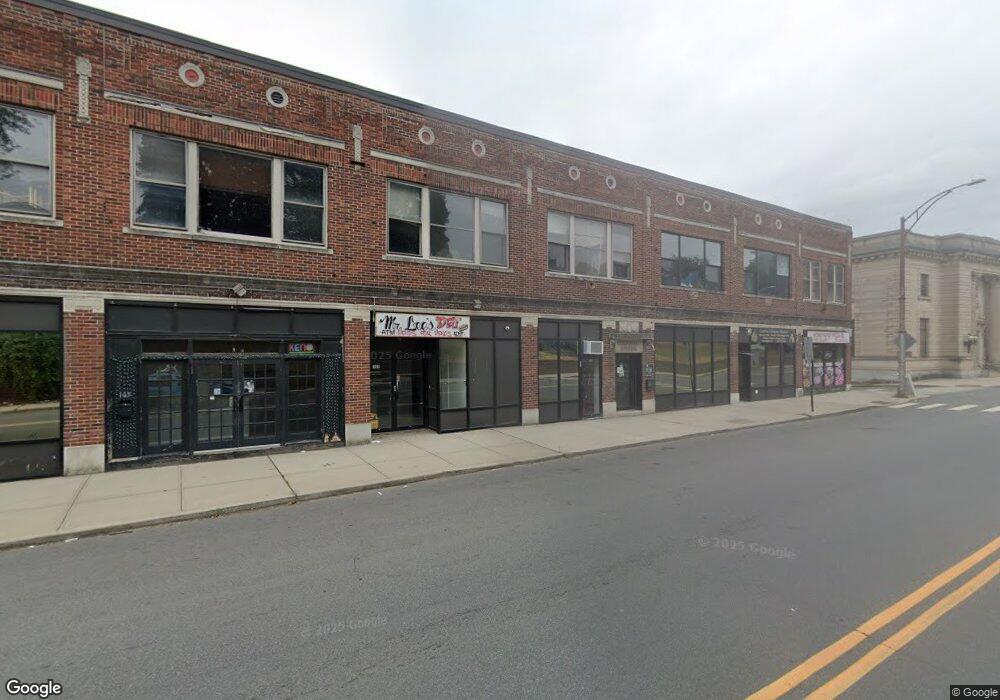
105 Colony St Meriden, CT 06451
Estimated Value: $948,588
3
Beds
20
Baths
30,401
Sq Ft
$31/Sq Ft
Est. Value
About This Home
This home is located at 105 Colony St, Meriden, CT 06451 and is currently estimated at $948,588, approximately $31 per square foot. 105 Colony St is a home located in New Haven County with nearby schools including John Barry School, Lincoln Middle School, and Orville H. Platt High School.
Ownership History
Date
Name
Owned For
Owner Type
Purchase Details
Closed on
Jan 19, 2023
Sold by
Khalid Enterprises Inc
Bought by
Khj Inc
Current Estimated Value
Purchase Details
Closed on
Feb 16, 2018
Sold by
105 Colony Street Llc
Bought by
Khalid Enterprises Inc
Purchase Details
Closed on
Aug 3, 2005
Sold by
Pal Commercial Bldg Ll and Paguni Anthony J
Bought by
105 Colony Street Llc
Home Financials for this Owner
Home Financials are based on the most recent Mortgage that was taken out on this home.
Original Mortgage
$425,000
Interest Rate
5.63%
Mortgage Type
Commercial
Purchase Details
Closed on
Feb 3, 2003
Sold by
Aramony Rosemary E
Bought by
Paguni Anthony J
Purchase Details
Closed on
Oct 16, 1998
Sold by
Paguni Sebastian J
Bought by
Pal Commrcl Bldg Llc
Home Financials for this Owner
Home Financials are based on the most recent Mortgage that was taken out on this home.
Original Mortgage
$300,000
Interest Rate
0.08%
Mortgage Type
Commercial
Create a Home Valuation Report for This Property
The Home Valuation Report is an in-depth analysis detailing your home's value as well as a comparison with similar homes in the area
Home Values in the Area
Average Home Value in this Area
Purchase History
| Date | Buyer | Sale Price | Title Company |
|---|---|---|---|
| Khj Inc | -- | None Available | |
| Khalid Enterprises Inc | $350,000 | -- | |
| 105 Colony Street Llc | $598,500 | -- | |
| Paguni Anthony J | $150,000 | -- | |
| Pal Commrcl Bldg Llc | $43,000 | -- |
Source: Public Records
Mortgage History
| Date | Status | Borrower | Loan Amount |
|---|---|---|---|
| Previous Owner | Pal Commrcl Bldg Llc | $425,000 | |
| Previous Owner | Pal Commrcl Bldg Llc | $300,000 |
Source: Public Records
Tax History Compared to Growth
Tax History
| Year | Tax Paid | Tax Assessment Tax Assessment Total Assessment is a certain percentage of the fair market value that is determined by local assessors to be the total taxable value of land and additions on the property. | Land | Improvement |
|---|---|---|---|---|
| 2024 | $24,466 | $635,320 | $111,650 | $523,670 |
| 2023 | $23,583 | $635,320 | $111,650 | $523,670 |
| 2022 | $19,724 | $563,220 | $111,650 | $451,570 |
| 2021 | $22,905 | $526,190 | $91,350 | $434,840 |
| 2020 | $22,842 | $526,190 | $91,350 | $434,840 |
| 2019 | $21,960 | $510,230 | $91,350 | $418,880 |
| 2018 | $22,047 | $510,230 | $91,350 | $418,880 |
| 2017 | $21,460 | $510,230 | $91,350 | $418,880 |
| 2016 | $16,642 | $429,240 | $91,350 | $337,890 |
| 2015 | $16,642 | $429,240 | $91,350 | $337,890 |
| 2014 | $16,238 | $429,240 | $91,350 | $337,890 |
Source: Public Records
Map
Nearby Homes
- 113 Colony St Unit PARK
- 93 Colony St
- 89 Colony St
- 123 Colony St
- 127 Colony St
- 88 State St
- 128 Colony St
- 61 Colony St Unit 3B Furnished
- 61 Colony St Unit 2B
- 61 Colony St Unit 2A
- 61 Colony St Unit 2C
- 61 Colony St
- 5 Cross St
- 41 Lincoln St
- 138 Colony St
- 47 Lincoln St
- 55 Colony St
- 24 Lincoln St
- 16 Lincoln St