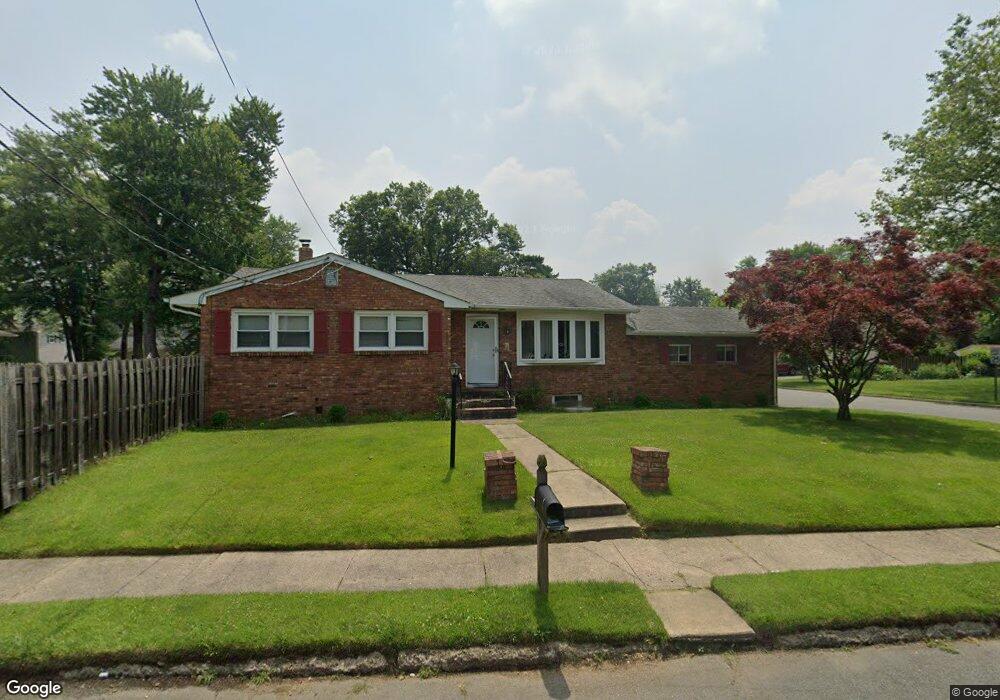
105 Crescent Ave Ewing, NJ 08638
Braeburn Heights NeighborhoodEstimated Value: $339,000 - $381,385
3
Beds
2
Baths
1,103
Sq Ft
$322/Sq Ft
Est. Value
About This Home
This home is located at 105 Crescent Ave, Ewing, NJ 08638 and is currently estimated at $355,596, approximately $322 per square foot. 105 Crescent Ave is a home located in Mercer County with nearby schools including Ewing High School and Trenton Stem-To-Civics Charter School.
Ownership History
Date
Name
Owned For
Owner Type
Purchase Details
Closed on
Sep 12, 2020
Sold by
Black Horse Village Llc
Bought by
Gp Real Estate Holdings Llc
Current Estimated Value
Purchase Details
Closed on
Sep 27, 2010
Sold by
Clarke James
Bought by
Black Horse Village Llc
Purchase Details
Closed on
Dec 22, 2009
Sold by
Wood Samira
Bought by
Clarke James
Purchase Details
Closed on
Aug 1, 2006
Sold by
Chen Chih Hong
Bought by
Wood Samira
Home Financials for this Owner
Home Financials are based on the most recent Mortgage that was taken out on this home.
Original Mortgage
$211,500
Interest Rate
6.8%
Purchase Details
Closed on
Apr 30, 2004
Sold by
Avery Robert
Bought by
Chen Chih and Yuh Yen Hsiao
Home Financials for this Owner
Home Financials are based on the most recent Mortgage that was taken out on this home.
Original Mortgage
$166,500
Interest Rate
6.33%
Purchase Details
Closed on
Nov 7, 1990
Sold by
Wilson Alton U and Wilson Yvonne G
Bought by
Avery Robert L and Avery Lillian M
Create a Home Valuation Report for This Property
The Home Valuation Report is an in-depth analysis detailing your home's value as well as a comparison with similar homes in the area
Home Values in the Area
Average Home Value in this Area
Purchase History
| Date | Buyer | Sale Price | Title Company |
|---|---|---|---|
| Gp Real Estate Holdings Llc | $215,000 | Integra Title & Abstract | |
| Black Horse Village Llc | $165,000 | General Abstract & Title Age | |
| Clarke James | $56,600 | Commonwealth Land Title Insu | |
| Wood Samira | $235,000 | -- | |
| Chen Chih | $185,000 | -- | |
| Avery Robert L | $110,000 | -- |
Source: Public Records
Mortgage History
| Date | Status | Borrower | Loan Amount |
|---|---|---|---|
| Previous Owner | Wood Samira | $211,500 | |
| Previous Owner | Chen Chih | $166,500 |
Source: Public Records
Tax History
| Year | Tax Paid | Tax Assessment Tax Assessment Total Assessment is a certain percentage of the fair market value that is determined by local assessors to be the total taxable value of land and additions on the property. | Land | Improvement |
|---|---|---|---|---|
| 2025 | $7,838 | $199,300 | $48,900 | $150,400 |
| 2024 | $7,368 | $199,300 | $48,900 | $150,400 |
| 2023 | $7,368 | $199,300 | $48,900 | $150,400 |
| 2022 | $7,169 | $199,300 | $48,900 | $150,400 |
| 2021 | $6,993 | $199,300 | $48,900 | $150,400 |
| 2020 | $5,105 | $147,600 | $48,900 | $98,700 |
| 2019 | $4,973 | $147,600 | $48,900 | $98,700 |
| 2018 | $5,224 | $98,900 | $29,700 | $69,200 |
| 2017 | $5,346 | $98,900 | $29,700 | $69,200 |
| 2016 | $5,273 | $98,900 | $29,700 | $69,200 |
| 2015 | $5,203 | $98,900 | $29,700 | $69,200 |
| 2014 | $5,189 | $98,900 | $29,700 | $69,200 |
Source: Public Records
Map
Nearby Homes
- 120 Sussex St
- 28 Brattle Ave
- 140 Crescent Ave
- 161 Louisiana Ave
- 186 Upland Ave
- 40 Arden Ave
- 200 Upland Ave
- 124 Hawthorne Ave
- 137 Ardsley Ave
- 20 Steinway Ave
- 37 Central Ave
- 50 Groveland Ave
- 16 Bittersweet Rd
- 42 Running Brook Rd
- 4 Blossom Dr
- 991 Terrace Blvd
- 41 Poland St
- 91 Groveland Ave
- 126 Rutledge Ave
- 43 Iowana Ave
Your Personal Tour Guide
Ask me questions while you tour the home.