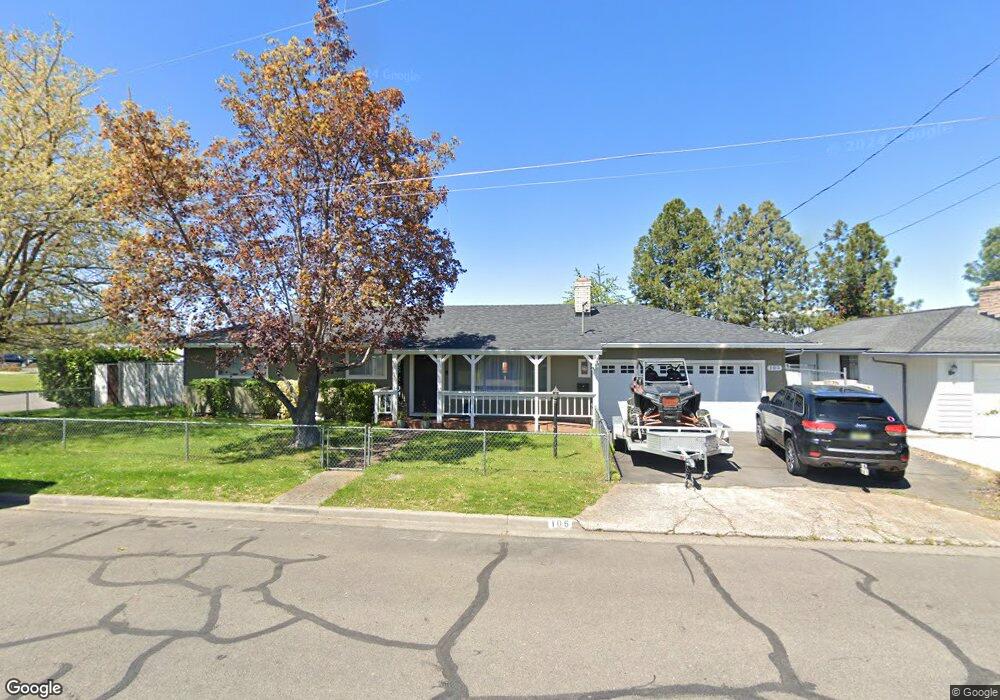
105 Cupp Dr Central Point, OR 97502
Estimated Value: $326,000 - $366,000
3
Beds
1
Bath
1,536
Sq Ft
$226/Sq Ft
Est. Value
About This Home
This home is located at 105 Cupp Dr, Central Point, OR 97502 and is currently estimated at $347,839, approximately $226 per square foot. 105 Cupp Dr is a home located in Jackson County with nearby schools including Central Point Elementary School, Scenic Middle School, and Crater High School.
Ownership History
Date
Name
Owned For
Owner Type
Purchase Details
Closed on
Mar 20, 2007
Sold by
Matheny Carla Jo
Bought by
Chandler Mark
Current Estimated Value
Home Financials for this Owner
Home Financials are based on the most recent Mortgage that was taken out on this home.
Original Mortgage
$62,000
Outstanding Balance
$37,068
Interest Rate
6.31%
Mortgage Type
Purchase Money Mortgage
Estimated Equity
$310,771
Purchase Details
Closed on
Apr 14, 2005
Sold by
Alvarado Rafael and Alvarado Rosario
Bought by
Matheny Carla Jo
Purchase Details
Closed on
May 28, 2003
Sold by
Vig Waed G and Vig Dawn L
Bought by
Alvarado Rafael and Alvarado Rosario
Home Financials for this Owner
Home Financials are based on the most recent Mortgage that was taken out on this home.
Original Mortgage
$108,000
Interest Rate
5.75%
Mortgage Type
Purchase Money Mortgage
Purchase Details
Closed on
May 25, 2001
Sold by
Mead Samuel R
Bought by
Vig Waed G and Vig Dawn L
Home Financials for this Owner
Home Financials are based on the most recent Mortgage that was taken out on this home.
Original Mortgage
$101,408
Interest Rate
7.06%
Mortgage Type
FHA
Create a Home Valuation Report for This Property
The Home Valuation Report is an in-depth analysis detailing your home's value as well as a comparison with similar homes in the area
Purchase History
| Date | Buyer | Sale Price | Title Company |
|---|---|---|---|
| Chandler Mark | $200,000 | Ticor Title | |
| Matheny Carla Jo | $187,000 | Ticor Title | |
| Alvarado Rafael | $135,000 | Key Title Company | |
| Vig Waed G | $103,000 | Amerititle |
Source: Public Records
Mortgage History
| Date | Status | Borrower | Loan Amount |
|---|---|---|---|
| Open | Chandler Mark | $62,000 | |
| Previous Owner | Alvarado Rafael | $108,000 | |
| Previous Owner | Vig Waed G | $101,408 |
Source: Public Records
Tax History
| Year | Tax Paid | Tax Assessment Tax Assessment Total Assessment is a certain percentage of the fair market value that is determined by local assessors to be the total taxable value of land and additions on the property. | Land | Improvement |
|---|---|---|---|---|
| 2026 | $2,713 | $163,920 | -- | -- |
| 2025 | $2,646 | $159,150 | $55,450 | $103,700 |
| 2024 | $2,646 | $154,520 | $53,830 | $100,690 |
| 2023 | $2,561 | $150,020 | $52,260 | $97,760 |
| 2022 | $2,501 | $150,020 | $52,260 | $97,760 |
| 2021 | $2,430 | $145,660 | $50,740 | $94,920 |
| 2020 | $2,359 | $141,420 | $49,260 | $92,160 |
| 2019 | $2,301 | $133,320 | $46,430 | $86,890 |
| 2018 | $2,231 | $129,440 | $45,080 | $84,360 |
| 2017 | $2,175 | $129,440 | $45,080 | $84,360 |
| 2016 | $2,111 | $122,010 | $42,500 | $79,510 |
| 2015 | $2,023 | $122,010 | $42,500 | $79,510 |
| 2014 | $1,889 | $115,010 | $40,060 | $74,950 |
Source: Public Records
Map
Nearby Homes
- 755 S 4th St
- 1189 Lindsey Ct
- 114 Cedar St
- 436 Cheney Loop
- 887 Silver Fox Dr
- 827 Isherwood Dr
- 220 S 3rd St
- 736 Hemlock Ave
- 185 Logan Ave
- 350 Alder St
- 555 Freeman Rd Unit 73
- 555 Freeman Rd Unit 254
- 555 Freeman Rd Unit 105
- 555 Freeman Rd Unit 209
- 3364 Bursell Rd
- 3358 Bursell Rd
- 871 Holley Way
- 895 Holley Way
- 209 Corcoran Ln
- 1204 Heather Ln
Your Personal Tour Guide
Ask me questions while you tour the home.