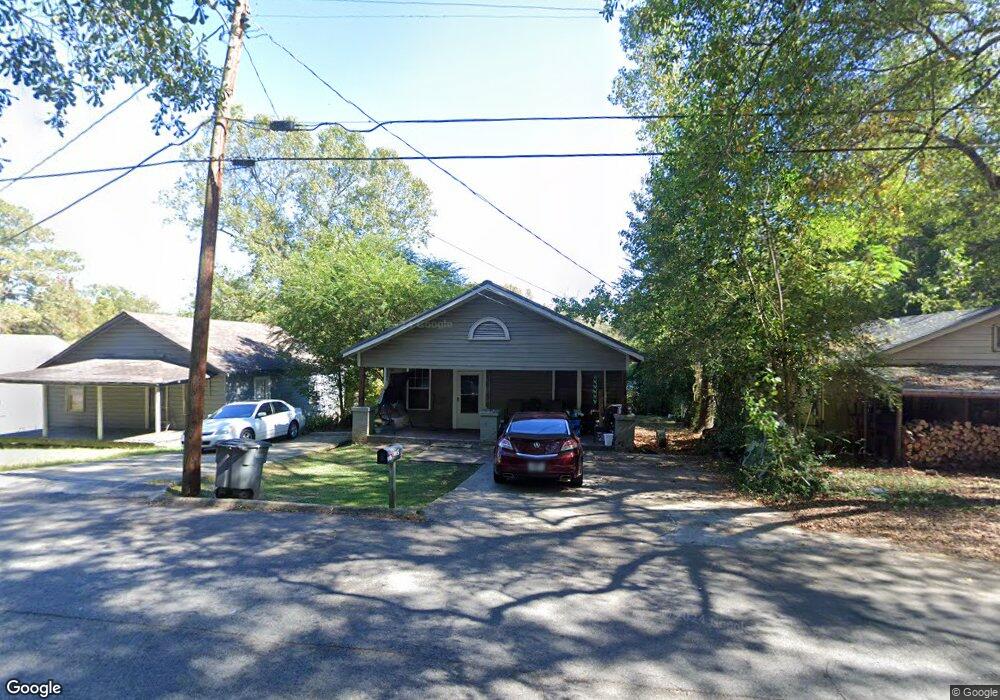
105 Daniel St Lagrange, GA 30241
Estimated Value: $81,000 - $115,672
3
Beds
1
Bath
1,260
Sq Ft
$76/Sq Ft
Est. Value
About This Home
This home is located at 105 Daniel St, Lagrange, GA 30241 and is currently estimated at $95,918, approximately $76 per square foot. 105 Daniel St is a home located in Troup County with nearby schools including Hollis Hand Elementary School, Franklin Forest Elementary School, and Ethel W. Kight Elementary School.
Ownership History
Date
Name
Owned For
Owner Type
Purchase Details
Closed on
Nov 30, 2021
Sold by
T Squared 1 Llc
Bought by
Brbrshy Investments Inc
Current Estimated Value
Purchase Details
Closed on
Jun 1, 2021
Sold by
Stribling Ty
Bought by
T Squared 1 Llc
Purchase Details
Closed on
Oct 13, 2003
Sold by
Martin J Miller
Bought by
Stribling Ty
Purchase Details
Closed on
Mar 1, 2001
Sold by
Madeline Moore Tucker
Bought by
Martin J Miller
Purchase Details
Closed on
Jun 24, 1993
Sold by
"Pete" Bryan W W
Bought by
Madeline Moore Tucker
Purchase Details
Closed on
Jan 24, 1992
Sold by
Stribling Phillip E
Bought by
"Pete" Bryan W W
Purchase Details
Closed on
May 10, 1979
Bought by
Stribling Phillip E
Purchase Details
Closed on
Oct 14, 1977
Sold by
Voided By Court
Purchase Details
Closed on
Jun 27, 1977
Sold by
Voided By Court
Bought by
Voided By Court
Purchase Details
Closed on
Jan 1, 1965
Sold by
Merritt D Daniel
Bought by
Voided By Court
Create a Home Valuation Report for This Property
The Home Valuation Report is an in-depth analysis detailing your home's value as well as a comparison with similar homes in the area
Purchase History
| Date | Buyer | Sale Price | Title Company |
|---|---|---|---|
| Brbrshy Investments Inc | $12,484,500 | -- | |
| T Squared 1 Llc | -- | -- | |
| Stribling Ty | $1,181,000 | -- | |
| Martin J Miller | $907,500 | -- | |
| Madeline Moore Tucker | $38,000 | -- | |
| "Pete" Bryan W W | -- | -- | |
| Stribling Phillip E | $4,300 | -- | |
| -- | -- | -- | |
| Voided By Court | -- | -- | |
| Voided By Court | -- | -- |
Source: Public Records
Tax History
| Year | Tax Paid | Tax Assessment Tax Assessment Total Assessment is a certain percentage of the fair market value that is determined by local assessors to be the total taxable value of land and additions on the property. | Land | Improvement |
|---|---|---|---|---|
| 2025 | $1,005 | $36,840 | $2,880 | $33,960 |
| 2024 | $892 | $32,720 | $2,880 | $29,840 |
| 2023 | $590 | $21,640 | $2,880 | $18,760 |
| 2022 | $573 | $20,520 | $2,880 | $17,640 |
| 2021 | $250 | $8,280 | $1,600 | $6,680 |
| 2020 | $250 | $8,280 | $1,600 | $6,680 |
| 2019 | $212 | $7,040 | $1,280 | $5,760 |
| 2018 | $212 | $7,040 | $1,280 | $5,760 |
| 2017 | $212 | $7,040 | $1,280 | $5,760 |
| 2016 | $230 | $7,641 | $1,200 | $6,441 |
| 2015 | $231 | $7,641 | $1,200 | $6,441 |
| 2014 | $231 | $7,641 | $1,200 | $6,441 |
| 2013 | -- | $8,564 | $1,200 | $7,364 |
Source: Public Records
Map
Nearby Homes
- 101 Daniel St
- 808 Hines St
- 304 Render St
- 803 Hines St
- 310 Render St
- 805 Hines St
- 109 1/2 Daniel St
- 799 Hines St
- 111 Daniel St
- 210 Render St
- 312 Render St
- 0 NE Davis By Pass and Big Spring Unit 7075098
- 215 Render St
- 113 Daniel St
- 211 Render St
- 314 Render St
- 209 Render St
- 206 Render St
- 705 Hines St
- 316 Render St
Your Personal Tour Guide
Ask me questions while you tour the home.