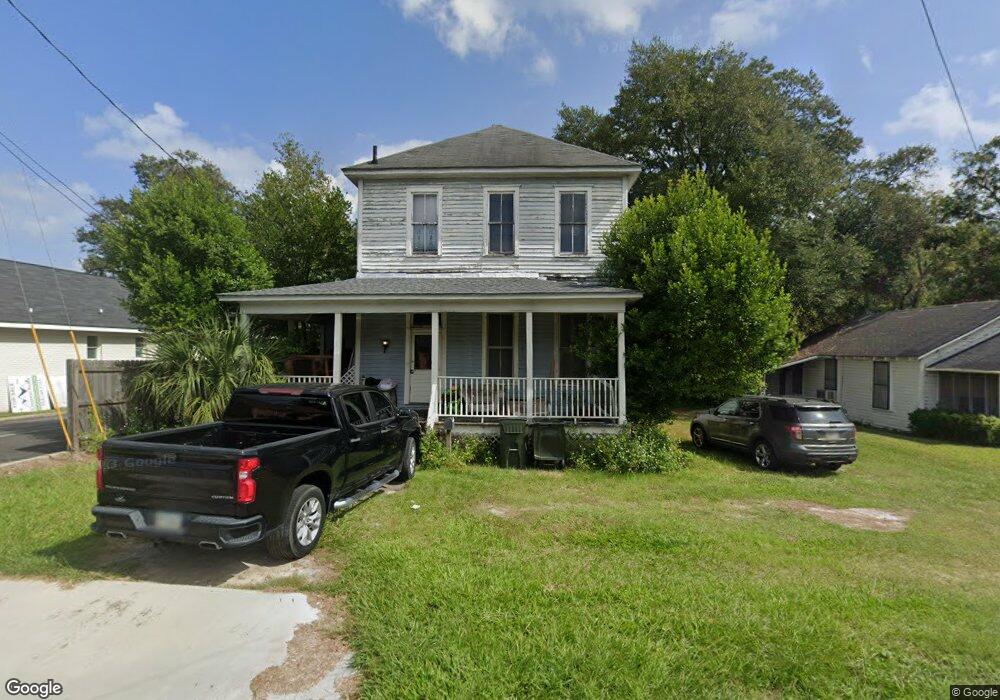
105 Dewey St Waycross, GA 31501
Estimated Value: $115,000 - $178,000
4
Beds
2
Baths
2,000
Sq Ft
$71/Sq Ft
Est. Value
About This Home
This home is located at 105 Dewey St, Waycross, GA 31501 and is currently estimated at $142,292, approximately $71 per square foot. 105 Dewey St is a home located in Ware County with nearby schools including Williams Heights Elementary School, Waycross Middle School, and Ware County High School.
Ownership History
Date
Name
Owned For
Owner Type
Purchase Details
Closed on
Dec 7, 2006
Sold by
Mulkey Robert Chad
Bought by
Merritt Riley Anthony
Current Estimated Value
Home Financials for this Owner
Home Financials are based on the most recent Mortgage that was taken out on this home.
Original Mortgage
$61,700
Outstanding Balance
$36,889
Interest Rate
6.31%
Mortgage Type
New Conventional
Estimated Equity
$105,403
Purchase Details
Closed on
Sep 8, 2004
Sold by
Chambless Myra H Ds 3-10-05
Bought by
Mulkey Robert C
Purchase Details
Closed on
Dec 14, 1999
Sold by
Chambless Ira G and Chambless My
Bought by
Chambless Myra H
Purchase Details
Closed on
Oct 20, 1997
Sold by
Mulkey Sharon C
Bought by
Chambless Ira G and Chambless My
Purchase Details
Closed on
Aug 15, 1995
Bought by
Mulkey Sharon C
Purchase Details
Closed on
Jun 11, 1985
Bought by
Chambless Ira and Chambless Myra
Purchase Details
Closed on
Dec 27, 1982
Bought by
Chambless Rudolph I
Create a Home Valuation Report for This Property
The Home Valuation Report is an in-depth analysis detailing your home's value as well as a comparison with similar homes in the area
Home Values in the Area
Average Home Value in this Area
Purchase History
| Date | Buyer | Sale Price | Title Company |
|---|---|---|---|
| Merritt Riley Anthony | $61,700 | -- | |
| Mulkey Robert C | $12,500 | -- | |
| Chambless Myra H | -- | -- | |
| Chambless Ira G | -- | -- | |
| Mulkey Sharon C | -- | -- | |
| Chambless Ira | -- | -- | |
| Chambless Rudolph I | -- | -- |
Source: Public Records
Mortgage History
| Date | Status | Borrower | Loan Amount |
|---|---|---|---|
| Open | Merritt Riley Anthony | $61,700 |
Source: Public Records
Tax History Compared to Growth
Tax History
| Year | Tax Paid | Tax Assessment Tax Assessment Total Assessment is a certain percentage of the fair market value that is determined by local assessors to be the total taxable value of land and additions on the property. | Land | Improvement |
|---|---|---|---|---|
| 2024 | $1,479 | $46,584 | $3,200 | $43,384 |
| 2023 | $1,322 | $39,488 | $2,246 | $37,242 |
| 2022 | $1,333 | $39,488 | $2,246 | $37,242 |
| 2021 | $1,223 | $32,405 | $2,246 | $30,159 |
| 2020 | $1,107 | $28,018 | $2,246 | $25,772 |
| 2019 | $1,096 | $27,104 | $2,246 | $24,858 |
| 2018 | $1,081 | $26,190 | $2,246 | $23,944 |
| 2017 | $1,054 | $26,190 | $2,246 | $23,944 |
| 2016 | $1,054 | $26,190 | $2,246 | $23,944 |
| 2015 | $1,061 | $26,190 | $2,246 | $23,944 |
| 2014 | $1,060 | $26,190 | $2,246 | $23,944 |
| 2013 | -- | $25,739 | $2,246 | $23,493 |
Source: Public Records
Map
Nearby Homes
- 415 Dewey St
- 502 Dewey St
- 310 Butler St
- 1405 Grove Ave
- 301 Riverside Dr
- 807 College St
- 506 Magnolia Dr
- 511 Riverside Dr
- 511 Richmond Ave
- 1504 Habersham Dr
- 924 Highsmith St
- 418 Reed St
- 1101 Cherokee Dr
- 306 Lee Ave
- 808 Satilla Blvd
- .22 Alice St
- 0 Goodwin St
- 713 Magnolia Dr
- 629 Remshart St
- 707 Euclid Ave
- 109 Dewey St
- 302 Screven Ave
- 000 Franklin St
- 0 Franklin St
- 201 Dewey St
- 310 Screven Ave Unit 1
- 310 Screven Ave
- 104 Dewey St
- 301 College St
- 307 College St
- 400 Screven Ave
- 215 Franklin St
- 309 College St
- 402 Screven Ave
- 214 Screven Ave
- 401 College St
- 0 Quarterman St
- 0 Quarterman St Unit 33874
- 0 Quarterman St Unit 8522146
- 0 Quarterman St Unit 8300166