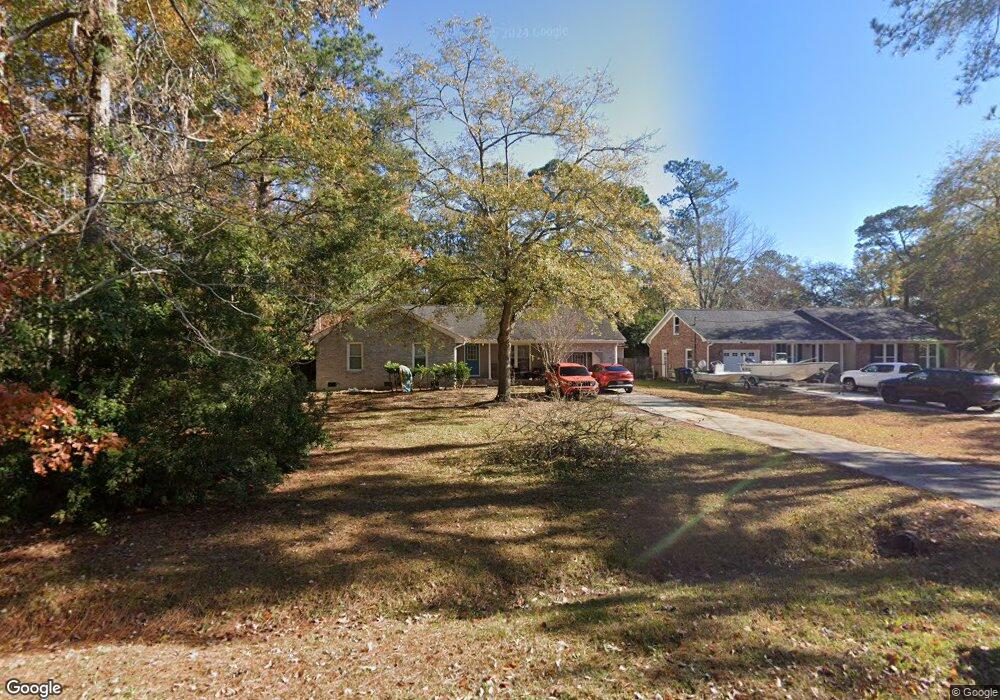
105 Donna Dr Summerville, SC 29483
Estimated Value: $278,000 - $326,375
4
Beds
2
Baths
1,635
Sq Ft
$180/Sq Ft
Est. Value
About This Home
This home is located at 105 Donna Dr, Summerville, SC 29483 and is currently estimated at $294,344, approximately $180 per square foot. 105 Donna Dr is a home located in Dorchester County with nearby schools including Summerville Elementary School, Charles B. DuBose Middle School, and Summerville High School.
Ownership History
Date
Name
Owned For
Owner Type
Purchase Details
Closed on
Mar 20, 2019
Sold by
Brown Nancy Nellis and Brown Donald A
Bought by
Davis Daniel N and Davis Doris H
Current Estimated Value
Purchase Details
Closed on
Oct 11, 2013
Sold by
Iron Gate Homes Llc
Bought by
Brown Latoya Denise and Brown Vincent Edward
Home Financials for this Owner
Home Financials are based on the most recent Mortgage that was taken out on this home.
Original Mortgage
$150,228
Interest Rate
4.5%
Mortgage Type
FHA
Purchase Details
Closed on
Apr 22, 2013
Sold by
Fannie Mae
Bought by
Iron Gate Homes Llc
Purchase Details
Closed on
Nov 7, 2012
Sold by
Flores Ann Marie
Bought by
Federal National Mortgage Association
Purchase Details
Closed on
Aug 21, 2003
Sold by
Melfi Anthony T
Bought by
Flores Israel and Flores Ann Marie
Purchase Details
Closed on
Mar 12, 2001
Sold by
Bryant Jennie L and Lynn Jennie
Bought by
Melfi Anthony T
Create a Home Valuation Report for This Property
The Home Valuation Report is an in-depth analysis detailing your home's value as well as a comparison with similar homes in the area
Home Values in the Area
Average Home Value in this Area
Purchase History
| Date | Buyer | Sale Price | Title Company |
|---|---|---|---|
| Davis Daniel N | $150,000 | None Available | |
| Brown Latoya Denise | $153,000 | -- | |
| Iron Gate Homes Llc | $66,650 | -- | |
| Federal National Mortgage Association | $68,000 | -- | |
| Flores Israel | $129,900 | Lowcountry Title Svcs Llc | |
| Melfi Anthony T | $1,350 | -- |
Source: Public Records
Mortgage History
| Date | Status | Borrower | Loan Amount |
|---|---|---|---|
| Previous Owner | Brown Latoya Denise | $150,228 |
Source: Public Records
Tax History Compared to Growth
Tax History
| Year | Tax Paid | Tax Assessment Tax Assessment Total Assessment is a certain percentage of the fair market value that is determined by local assessors to be the total taxable value of land and additions on the property. | Land | Improvement |
|---|---|---|---|---|
| 2025 | $1,918 | $11,739 | $3,200 | $8,539 |
| 2024 | $1,918 | $11,739 | $3,200 | $8,539 |
| 2023 | $1,918 | $5,060 | $1,400 | $3,660 |
| 2022 | $1,554 | $6,450 | $1,400 | $5,050 |
| 2021 | $1,658 | $6,450 | $1,400 | $5,050 |
| 2020 | $1,530 | $6,120 | $1,200 | $4,920 |
| 2019 | $1,494 | $6,120 | $1,200 | $4,920 |
| 2018 | $1,423 | $6,120 | $1,200 | $4,920 |
| 2017 | $1,396 | $6,120 | $1,200 | $4,920 |
| 2016 | $1,378 | $6,120 | $1,200 | $4,920 |
| 2015 | $3,621 | $9,180 | $1,800 | $7,380 |
| 2014 | $3,572 | $152,999 | $0 | $0 |
| 2013 | -- | $7,160 | $0 | $0 |
Source: Public Records
Map
Nearby Homes
- 108 Helen Dr
- 102 Candlelite Path Unit 102,104,106,108
- 109 Candlelite Path
- 301 Corey Blvd
- 114 Reynolds Rd
- 100 Fairway Dr
- 108 Fairway Dr
- 408 Country Club Blvd
- 618 Boone Hill Rd
- 901 Simmons Ave
- 100 Duck Blind Ct
- 121 Mary Ann Dr
- 101 Dukes Ct
- 111 Driver Ave
- 118 Driver Ave
- 113 Tea Farm Rd
- 115 Loblolly Ln
- 206 President Cir
- 215 Marion Ave
- 122 Five Iron Cir
- 103 Donna Dr
- 110 Pinecrest Blvd
- 108 Pinecrest Blvd
- 101 Donna Dr
- 115 Donna Dr
- 157 Pinecrest Blvd
- 112 Pinecrest Blvd
- 110 Donna Dr
- 112 Donna Dr
- 114 Donna Dr
- 106 Pinecrest Blvd
- 108 Donna Dr
- 116 Donna Dr
- 106 Donna Dr
- 210 Boone Hill Pkwy
- 117 Donna Dr
- 100 Pinecrest Blvd
- 118 Donna Dr
- 104 Donna Dr
- 114 Pinecrest Blvd