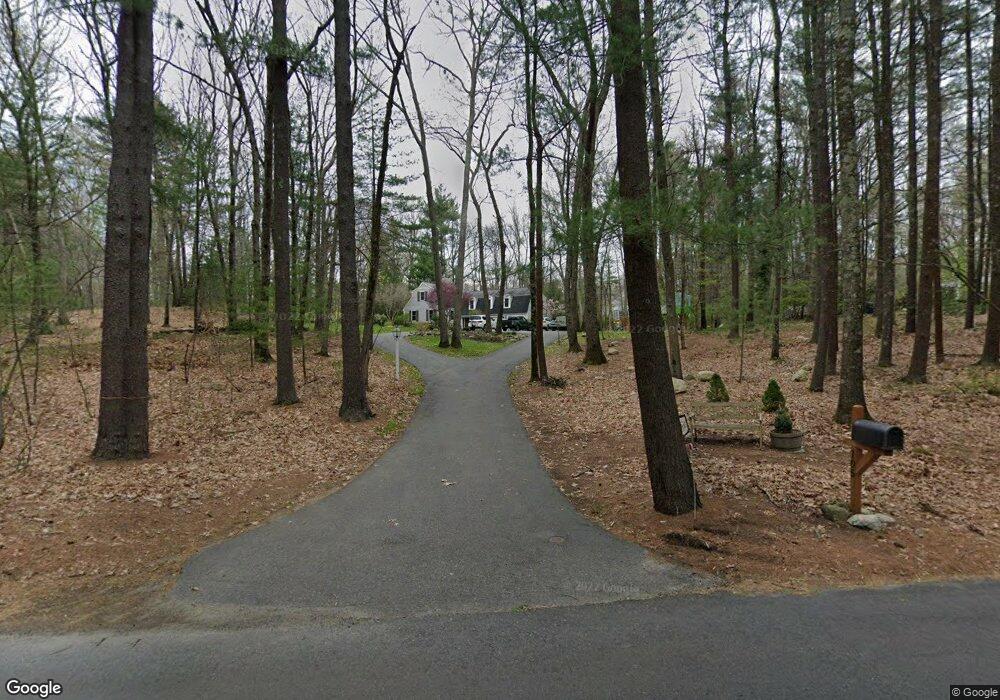
105 Draper Rd Wayland, MA 01778
Estimated Value: $1,655,383 - $1,900,000
4
Beds
4
Baths
3,800
Sq Ft
$471/Sq Ft
Est. Value
About This Home
This home is located at 105 Draper Rd, Wayland, MA 01778 and is currently estimated at $1,790,846, approximately $471 per square foot. 105 Draper Rd is a home located in Middlesex County with nearby schools including Wayland High School.
Ownership History
Date
Name
Owned For
Owner Type
Purchase Details
Closed on
May 27, 2020
Sold by
Bell Anthony E and Davis-Bell Melissa
Bought by
Bell Anthony E and Davis-Bell Melissa
Current Estimated Value
Home Financials for this Owner
Home Financials are based on the most recent Mortgage that was taken out on this home.
Original Mortgage
$582,000
Outstanding Balance
$511,192
Interest Rate
3.3%
Mortgage Type
New Conventional
Estimated Equity
$1,279,654
Purchase Details
Closed on
Jan 30, 2009
Sold by
105 Draper Road Nt and Kelleigh
Bought by
Cohen Matthew S
Home Financials for this Owner
Home Financials are based on the most recent Mortgage that was taken out on this home.
Original Mortgage
$804,000
Interest Rate
5.28%
Mortgage Type
Purchase Money Mortgage
Create a Home Valuation Report for This Property
The Home Valuation Report is an in-depth analysis detailing your home's value as well as a comparison with similar homes in the area
Home Values in the Area
Average Home Value in this Area
Purchase History
| Date | Buyer | Sale Price | Title Company |
|---|---|---|---|
| Bell Anthony E | -- | None Available | |
| Cohen Matthew S | $725,000 | -- | |
| Cohen Matthew S | $725,000 | -- |
Source: Public Records
Mortgage History
| Date | Status | Borrower | Loan Amount |
|---|---|---|---|
| Open | Bell Anthony E | $582,000 | |
| Previous Owner | Cohen Matthew S | $45,000 | |
| Previous Owner | Cohen Matthew S | $804,000 | |
| Previous Owner | Cohen Matthew S | $99,000 |
Source: Public Records
Tax History
| Year | Tax Paid | Tax Assessment Tax Assessment Total Assessment is a certain percentage of the fair market value that is determined by local assessors to be the total taxable value of land and additions on the property. | Land | Improvement |
|---|---|---|---|---|
| 2025 | $23,301 | $1,490,800 | $681,200 | $809,600 |
| 2024 | $22,069 | $1,422,000 | $648,500 | $773,500 |
| 2023 | $21,359 | $1,282,800 | $589,500 | $693,300 |
| 2022 | $21,095 | $1,149,600 | $488,500 | $661,100 |
| 2021 | $6,451 | $1,084,700 | $444,400 | $640,300 |
| 2020 | $19,559 | $1,101,300 | $444,400 | $656,900 |
| 2019 | $5,264 | $1,027,200 | $423,400 | $603,800 |
| 2018 | $4,867 | $940,500 | $423,400 | $517,100 |
| 2017 | $16,674 | $919,200 | $410,200 | $509,000 |
| 2016 | $15,674 | $903,900 | $419,300 | $484,600 |
| 2015 | $16,398 | $891,700 | $419,300 | $472,400 |
Source: Public Records
Map
Nearby Homes
- 101 Draper Rd
- 32 Highland Cir
- 4 Peartree Ln
- 21 Decatur Ln
- 127 Glezen Ln
- 63 Sudbury Rd
- 20 Hickory Hill Rd
- 63 Claypit Hill Rd
- 37 Orchard Ln
- 291 Concord Rd
- 20 Lee Rd
- 93 Old Sudbury Rd
- 156 Cherry Brook Rd
- 13 Rich Valley Rd
- 156 Boston Post Rd
- 823 Boston Post Rd
- 17 Glezen Ln
- 55 Sherman's Bridge Rd
- 741 Boston Post Rd
- 2 Old Sudbury Rd
Your Personal Tour Guide
Ask me questions while you tour the home.