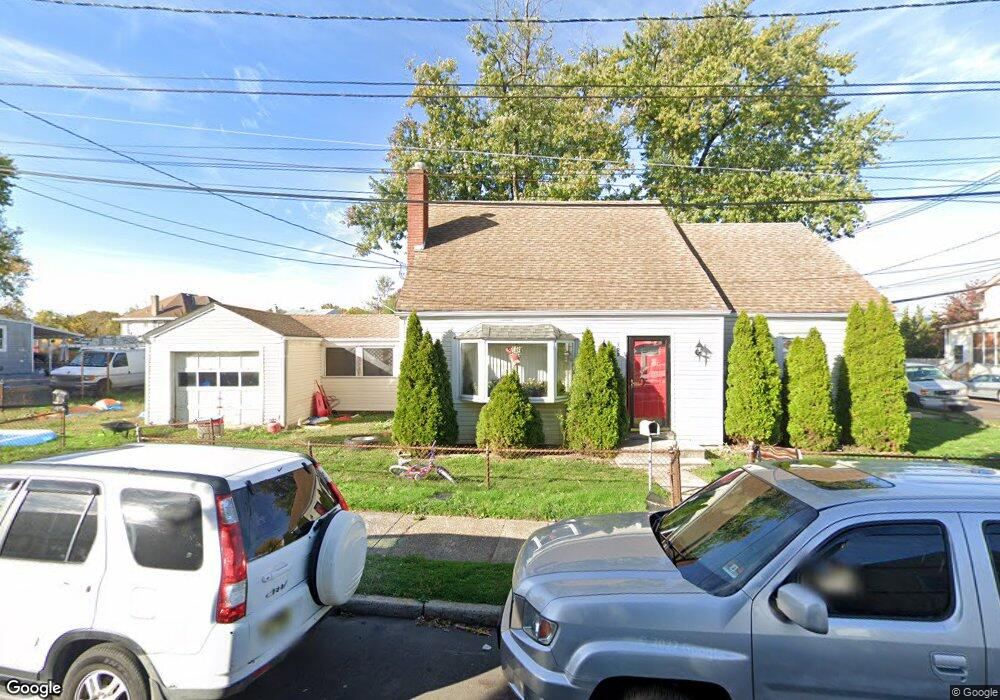
105 Durand Ave Trenton, NJ 08611
Franklin Park NeighborhoodEstimated Value: $256,294 - $381,000
--
Bed
--
Bath
1,500
Sq Ft
$213/Sq Ft
Est. Value
About This Home
This home is located at 105 Durand Ave, Trenton, NJ 08611 and is currently estimated at $319,574, approximately $213 per square foot. 105 Durand Ave is a home located in Mercer County with nearby schools including Lalor Elementary School, Richard C. Crockett Middle School, and Hamilton West-Watson High School.
Ownership History
Date
Name
Owned For
Owner Type
Purchase Details
Closed on
Jan 20, 2012
Sold by
Small Annette M
Bought by
Hamilton Twp
Current Estimated Value
Purchase Details
Closed on
May 26, 2004
Purchase Details
Closed on
Aug 9, 1999
Sold by
Stevens Gary
Bought by
Vincent Annette
Home Financials for this Owner
Home Financials are based on the most recent Mortgage that was taken out on this home.
Original Mortgage
$83,947
Interest Rate
7.65%
Mortgage Type
FHA
Create a Home Valuation Report for This Property
The Home Valuation Report is an in-depth analysis detailing your home's value as well as a comparison with similar homes in the area
Home Values in the Area
Average Home Value in this Area
Purchase History
| Date | Buyer | Sale Price | Title Company |
|---|---|---|---|
| Hamilton Twp | $339 | None Available | |
| -- | -- | -- | |
| Vincent Annette | $84,000 | -- |
Source: Public Records
Mortgage History
| Date | Status | Borrower | Loan Amount |
|---|---|---|---|
| Previous Owner | Vincent Annette | $83,947 |
Source: Public Records
Tax History Compared to Growth
Tax History
| Year | Tax Paid | Tax Assessment Tax Assessment Total Assessment is a certain percentage of the fair market value that is determined by local assessors to be the total taxable value of land and additions on the property. | Land | Improvement |
|---|---|---|---|---|
| 2025 | $5,621 | $159,500 | $27,400 | $132,100 |
| 2024 | $5,268 | $159,500 | $27,400 | $132,100 |
| 2023 | $5,268 | $159,500 | $27,400 | $132,100 |
| 2022 | $5,185 | $159,500 | $27,400 | $132,100 |
| 2021 | $6,417 | $159,500 | $27,400 | $132,100 |
| 2020 | $5,842 | $159,500 | $27,400 | $132,100 |
| 2019 | $5,670 | $159,500 | $27,400 | $132,100 |
| 2018 | $5,679 | $161,900 | $29,800 | $132,100 |
| 2017 | $5,427 | $161,900 | $29,800 | $132,100 |
| 2016 | $4,378 | $161,900 | $29,800 | $132,100 |
| 2015 | $4,725 | $90,700 | $24,100 | $66,600 |
| 2014 | $4,663 | $90,700 | $24,100 | $66,600 |
Source: Public Records
Map
Nearby Homes