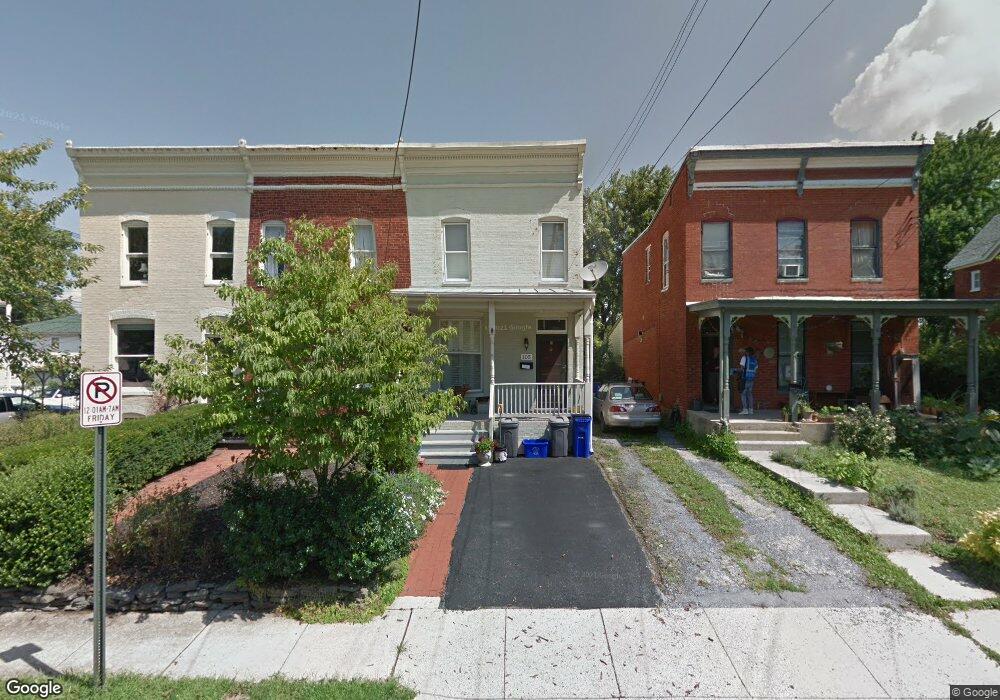
105 E 7th St Frederick, MD 21701
Selwyn Farms NeighborhoodEstimated Value: $490,000 - $543,000
Studio
2
Baths
1,864
Sq Ft
$279/Sq Ft
Est. Value
About This Home
This home is located at 105 E 7th St, Frederick, MD 21701 and is currently estimated at $519,997, approximately $278 per square foot. 105 E 7th St is a home located in Frederick County with nearby schools including North Frederick Elementary School, Gov. Thomas Johnson Middle School, and Gov. Thomas Johnson High School.
Ownership History
Date
Name
Owned For
Owner Type
Purchase Details
Closed on
Jul 10, 2012
Sold by
Mcgregor Alan R and Mcgregor Harriet
Bought by
Nieves Pedro N
Current Estimated Value
Home Financials for this Owner
Home Financials are based on the most recent Mortgage that was taken out on this home.
Original Mortgage
$228,000
Outstanding Balance
$157,906
Interest Rate
3.74%
Mortgage Type
New Conventional
Estimated Equity
$362,091
Purchase Details
Closed on
Aug 2, 2007
Sold by
Kr 105 East 7Th Llc
Bought by
Mcgregor Alan R and Mcgregor Harriet
Purchase Details
Closed on
Jul 30, 2007
Sold by
Kr 105 East 7Th Llc
Bought by
Mcgregor Alan R and Mcgregor Harriet
Purchase Details
Closed on
Jun 23, 2006
Sold by
Cool Edward Burnell and Cool Pauline
Bought by
Kr 105 East 7Th Llc
Purchase Details
Closed on
Mar 23, 2006
Sold by
Cool Edward Burnell and Cool Pauline
Bought by
Kr 105 East 7Th Llc
Create a Home Valuation Report for This Property
The Home Valuation Report is an in-depth analysis detailing your home's value as well as a comparison with similar homes in the area
Home Values in the Area
Average Home Value in this Area
Purchase History
| Date | Buyer | Sale Price | Title Company |
|---|---|---|---|
| Nieves Pedro N | $285,000 | First American Title Insuran | |
| Mcgregor Alan R | $349,900 | -- | |
| Mcgregor Alan R | $349,900 | -- | |
| Kr 105 East 7Th Llc | $85,000 | -- | |
| Kr 105 East 7Th Llc | $85,000 | -- |
Source: Public Records
Mortgage History
| Date | Status | Borrower | Loan Amount |
|---|---|---|---|
| Open | Nieves Pedro N | $228,000 |
Source: Public Records
Tax History
| Year | Tax Paid | Tax Assessment Tax Assessment Total Assessment is a certain percentage of the fair market value that is determined by local assessors to be the total taxable value of land and additions on the property. | Land | Improvement |
|---|---|---|---|---|
| 2025 | $6,947 | $442,200 | $120,800 | $321,400 |
| 2024 | $6,947 | $422,033 | -- | -- |
| 2023 | $6,437 | $401,867 | $0 | $0 |
| 2022 | $6,112 | $381,700 | $90,300 | $291,400 |
| 2021 | $5,506 | $351,400 | $0 | $0 |
| 2020 | $5,506 | $321,100 | $0 | $0 |
| 2019 | $5,229 | $290,800 | $60,000 | $230,800 |
| 2018 | $5,231 | $288,300 | $0 | $0 |
| 2017 | $5,134 | $290,800 | $0 | $0 |
| 2016 | $4,581 | $283,300 | $0 | $0 |
| 2015 | $4,581 | $271,667 | $0 | $0 |
| 2014 | $4,581 | $260,033 | $0 | $0 |
Source: Public Records
Map
Nearby Homes
Your Personal Tour Guide
Ask me questions while you tour the home.