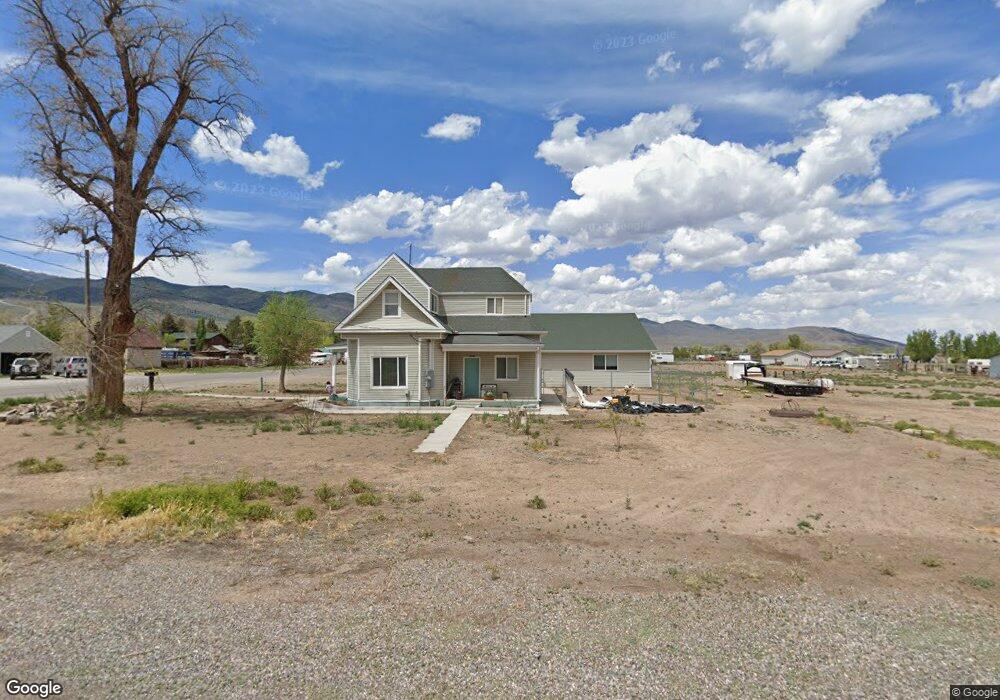
105 E Main St Joseph, UT 84739
Estimated Value: $498,661 - $741,000
6
Beds
5
Baths
4,617
Sq Ft
$127/Sq Ft
Est. Value
About This Home
This home is located at 105 E Main St, Joseph, UT 84739 and is currently estimated at $585,665, approximately $126 per square foot. 105 E Main St is a home located in Sevier County with nearby schools including Monroe School, South Sevier Middle School, and South Sevier High School.
Ownership History
Date
Name
Owned For
Owner Type
Purchase Details
Closed on
Mar 9, 2021
Sold by
Hare Connie and Estate Of Mary Elizabeth Farle
Bought by
Reyna Jesus Christian Avila
Current Estimated Value
Home Financials for this Owner
Home Financials are based on the most recent Mortgage that was taken out on this home.
Original Mortgage
$352,450
Outstanding Balance
$313,062
Interest Rate
2.7%
Mortgage Type
New Conventional
Estimated Equity
$272,603
Purchase Details
Closed on
May 23, 2013
Sold by
Farley Mary Elizabeth
Bought by
Farley Mary Elizabeth
Home Financials for this Owner
Home Financials are based on the most recent Mortgage that was taken out on this home.
Original Mortgage
$160,000
Interest Rate
3.37%
Mortgage Type
Purchase Money Mortgage
Create a Home Valuation Report for This Property
The Home Valuation Report is an in-depth analysis detailing your home's value as well as a comparison with similar homes in the area
Purchase History
| Date | Buyer | Sale Price | Title Company |
|---|---|---|---|
| Reyna Jesus Christian Avila | -- | First American Richfield | |
| Farley Mary Elizabeth | $112,000 | None Available |
Source: Public Records
Mortgage History
| Date | Status | Borrower | Loan Amount |
|---|---|---|---|
| Open | Reyna Jesus Christian Avila | $352,450 | |
| Previous Owner | Farley Mary Elizabeth | $160,000 |
Source: Public Records
Tax History
| Year | Tax Paid | Tax Assessment Tax Assessment Total Assessment is a certain percentage of the fair market value that is determined by local assessors to be the total taxable value of land and additions on the property. | Land | Improvement |
|---|---|---|---|---|
| 2025 | $2,179 | $251,250 | $20,726 | $230,524 |
| 2024 | $2,179 | $275,570 | $19,086 | $256,484 |
| 2023 | $2,429 | $246,718 | $12,635 | $234,083 |
| 2022 | $2,643 | $260,788 | $12,617 | $248,171 |
| 2021 | $2,030 | $165,487 | $13,201 | $152,286 |
| 2020 | $1,817 | $148,959 | $12,601 | $136,358 |
| 2019 | $1,912 | $148,360 | $12,000 | $136,360 |
| 2018 | $0 | $124,470 | $12,000 | $112,470 |
| 2017 | $1,399 | $102,340 | $12,000 | $90,340 |
| 2016 | $463 | $102,280 | $0 | $0 |
| 2015 | $463 | $102,280 | $0 | $0 |
| 2014 | $463 | $102,280 | $0 | $0 |
Source: Public Records
Map
Nearby Homes
- 225 N 100 E
- 85 N 100 W
- 89 Sevier Hwy
- 1085 S River Ridge Ln
- 100 S 100 E
- 260 N Sevier Hwy
- Tbd West County Rd 1875 Unit LotWP001
- 1952 Utah 118
- 871 N Brooklyn Rd
- 0 Approx 2115 Brooklyn Rd
- Tbd Highway 89
- Tbd Highway 89
- Tbd Highway 89
- Tbd Highway 89
- Tbd Highway 89
- Tbd Highway 89
- Tbd Highway 89
- 1103 N Brooklyn Rd
- 1025 S 800 E
- 904 S 570 W
Your Personal Tour Guide
Ask me questions while you tour the home.