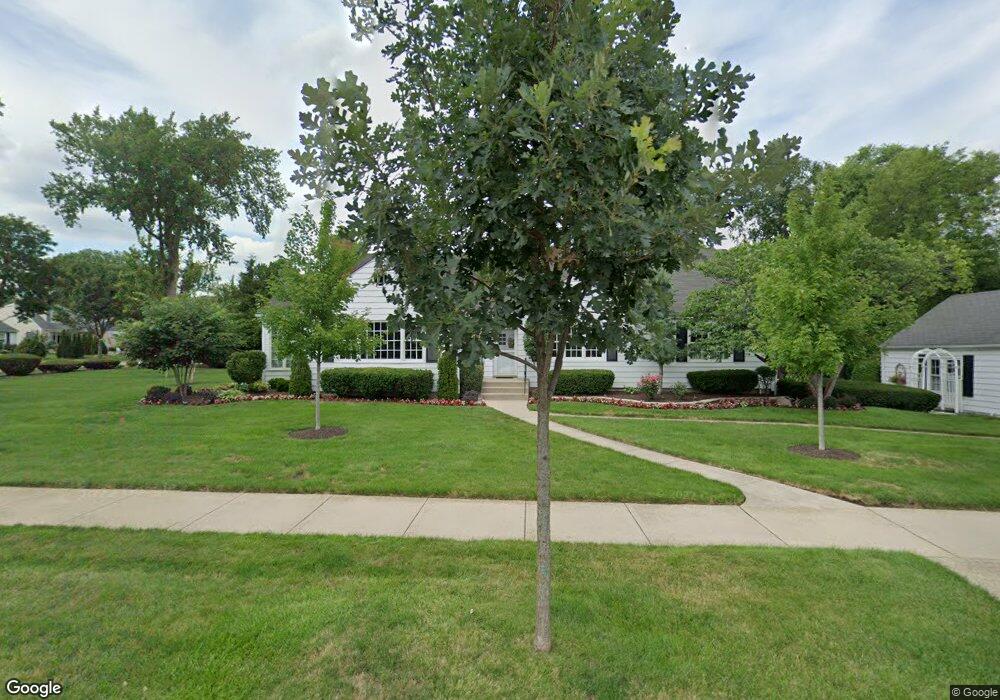
105 E May St Elmhurst, IL 60126
Estimated Value: $931,000 - $1,186,000
5
Beds
4
Baths
3,650
Sq Ft
$291/Sq Ft
Est. Value
About This Home
This home is located at 105 E May St, Elmhurst, IL 60126 and is currently estimated at $1,060,469, approximately $290 per square foot. 105 E May St is a home located in DuPage County with nearby schools including Edison Elementary School, Sandburg Middle School, and York Community High School.
Ownership History
Date
Name
Owned For
Owner Type
Purchase Details
Closed on
Jul 22, 2019
Sold by
Stavenger Lawrence A and Stavenger Phyllis J
Bought by
Stavenger Lawrence A and Stavenger Phyllis
Current Estimated Value
Home Financials for this Owner
Home Financials are based on the most recent Mortgage that was taken out on this home.
Original Mortgage
$1,089,787
Interest Rate
3.21%
Mortgage Type
FHA
Create a Home Valuation Report for This Property
The Home Valuation Report is an in-depth analysis detailing your home's value as well as a comparison with similar homes in the area
Home Values in the Area
Average Home Value in this Area
Purchase History
| Date | Buyer | Sale Price | Title Company |
|---|---|---|---|
| Stavenger Lawrence A | -- | Attorney |
Source: Public Records
Mortgage History
| Date | Status | Borrower | Loan Amount |
|---|---|---|---|
| Closed | Stavenger Lawrence A | $1,089,787 |
Source: Public Records
Tax History
| Year | Tax Paid | Tax Assessment Tax Assessment Total Assessment is a certain percentage of the fair market value that is determined by local assessors to be the total taxable value of land and additions on the property. | Land | Improvement |
|---|---|---|---|---|
| 2024 | $6,756 | $271,561 | $181,913 | $89,648 |
| 2023 | $6,806 | $251,120 | $168,220 | $82,900 |
| 2022 | $7,101 | $241,410 | $161,720 | $79,690 |
| 2021 | $7,108 | $235,410 | $157,700 | $77,710 |
| 2020 | $6,993 | $230,250 | $154,240 | $76,010 |
| 2019 | $7,214 | $218,910 | $146,640 | $72,270 |
| 2018 | $7,255 | $214,210 | $145,800 | $68,410 |
| 2017 | $7,462 | $204,130 | $138,940 | $65,190 |
| 2016 | $7,774 | $192,300 | $130,890 | $61,410 |
| 2015 | $8,289 | $179,150 | $121,940 | $57,210 |
| 2014 | $9,025 | $177,780 | $97,030 | $80,750 |
| 2013 | $8,797 | $180,290 | $98,400 | $81,890 |
Source: Public Records
Map
Nearby Homes
- 474 S York St
- 500 S Kenilworth Ave
- 15 Manchester Ln
- 224 E May St
- 570 S Parkside Ave
- 251 E South St
- 580 S Kearsage Ave
- 377 S Prairie Ave
- 406 S Poplar Ave
- 611 S Prospect Ave
- 160 E Cayuga Ave
- 680 S Bryan St
- 254 W Claremont St
- 330 E Saint Charles Rd
- 274 E Crescent Ave
- 266 W Claremont St
- 688 S Mitchell Ave
- 176 S Arlington Ave
- 696 S Prospect Ave
- 634 S Spring Rd
- 457 S York St
- 455 S York St
- 469 S York St
- 451 S York St
- 475 S York St
- 123 E May St
- 447 S York St
- 452 S Kenilworth Ave
- 479 S York St
- 446 S Kenilworth Ave
- 458 S York St
- 456 S York St
- 468 S Kenilworth Ave
- 460 S York St
- 452 S York St
- 466 S York St
- 470 S Kenilworth Ave
- 448 S York St
- 443 S York St
- 483 S York St
Your Personal Tour Guide
Ask me questions while you tour the home.