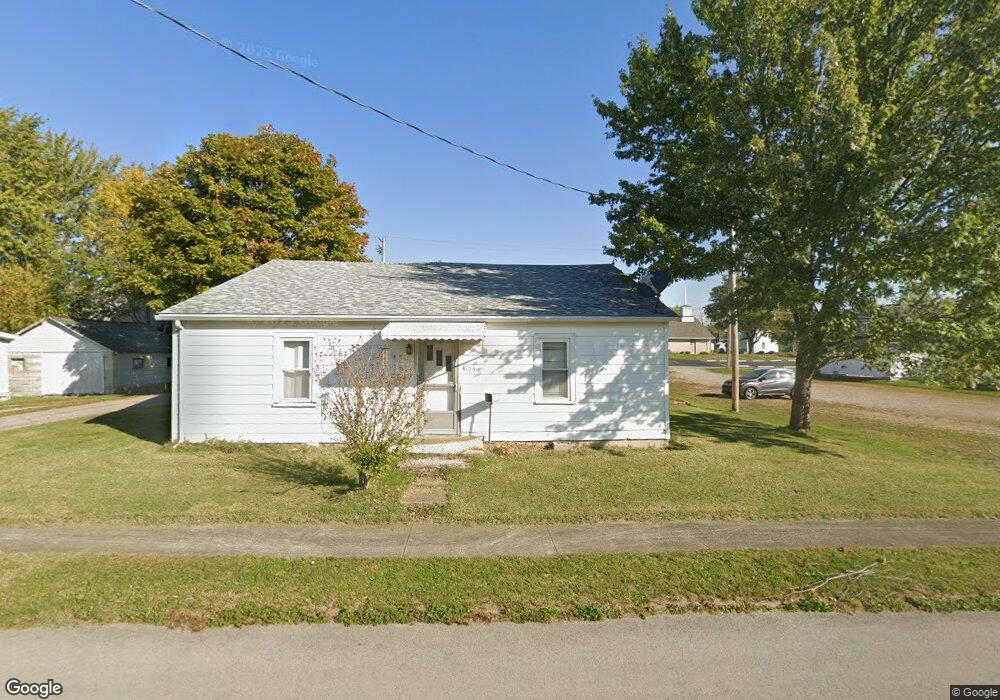
105 E Ohio St Waynesfield, OH 45896
Estimated Value: $128,192 - $167,000
2
Beds
1
Bath
1,632
Sq Ft
$94/Sq Ft
Est. Value
About This Home
This home is located at 105 E Ohio St, Waynesfield, OH 45896 and is currently estimated at $153,798, approximately $94 per square foot. 105 E Ohio St is a home located in Auglaize County with nearby schools including Waynesfield-Goshen Local Elementary School and Waynesfield-Goshen Local High School.
Ownership History
Date
Name
Owned For
Owner Type
Purchase Details
Closed on
Apr 15, 2025
Sold by
Lawrence Michael R and Lawrence Rebecca S
Bought by
Lawrence Chad M
Current Estimated Value
Purchase Details
Closed on
Feb 21, 2013
Sold by
Lawrence Rebecca S and Lawrence Michael R
Bought by
Lawrence Michael Ray and Rebecca Sue Lawrence Loving Trust
Purchase Details
Closed on
Jan 25, 2013
Sold by
Arthur Byron E and Arthur Nancy L
Bought by
Lawrence Rebecca S and Lawrence Becky
Purchase Details
Closed on
Jan 24, 2013
Sold by
Arthur Gary L and Arthur Connie L
Bought by
Lawrence Rebecca S and Lawrence Becky
Purchase Details
Closed on
May 25, 1990
Sold by
Surber Sharon K
Bought by
Lawrence Rebecca S
Create a Home Valuation Report for This Property
The Home Valuation Report is an in-depth analysis detailing your home's value as well as a comparison with similar homes in the area
Purchase History
| Date | Buyer | Sale Price | Title Company |
|---|---|---|---|
| Lawrence Chad M | -- | None Listed On Document | |
| Lawrence Chad M | -- | None Listed On Document | |
| Lawrence Michael R | -- | None Listed On Document | |
| Lawrence Michael R | -- | None Listed On Document | |
| Lawrence Michael Ray | -- | Attorney | |
| Lawrence Rebecca S | $10,000 | Attorney | |
| Lawrence Rebecca S | $20,000 | Attorney | |
| Lawrence Rebecca S | -- | -- |
Source: Public Records
Tax History
| Year | Tax Paid | Tax Assessment Tax Assessment Total Assessment is a certain percentage of the fair market value that is determined by local assessors to be the total taxable value of land and additions on the property. | Land | Improvement |
|---|---|---|---|---|
| 2025 | $2,061 | $31,860 | $3,010 | $28,850 |
| 2024 | $2,061 | $31,860 | $3,010 | $28,850 |
| 2023 | $1,203 | $31,860 | $3,010 | $28,850 |
| 2022 | $892 | $19,750 | $2,800 | $16,950 |
| 2021 | $874 | $19,750 | $2,800 | $16,950 |
| 2020 | $441 | $19,747 | $2,800 | $16,947 |
| 2019 | $703 | $16,458 | $2,335 | $14,123 |
| 2018 | $687 | $16,458 | $2,335 | $14,123 |
| 2017 | $685 | $16,458 | $2,335 | $14,123 |
| 2016 | $673 | $16,661 | $2,223 | $14,438 |
| 2015 | $347 | $16,661 | $2,223 | $14,438 |
| 2014 | $674 | $16,661 | $2,223 | $14,438 |
| 2013 | $383 | $16,661 | $2,223 | $14,438 |
Source: Public Records
Map
Nearby Homes
- 211 E Wapakoneta St
- 105 Guthrie St
- 25702 Ohio 67
- 533 N Westminster St
- 101 Sunrise Dr
- 18544 Santa Fe Line Rd
- 23481 Fairmount Rd
- 25353 Buckland Holden Rd
- 8150 Amherst Rd
- 21320 Fairmount Rd
- 20630 State Route 67
- 20228 Fairmount Rd
- 4850 Bowdle Rd
- 15281 US Highway 33
- 17 E Walnut St
- 0 Ohio 67
- 13412 County Road 88
- 7165 Faulkner Rd
- 3300 Johnston Rd
- 0 Center St
Your Personal Tour Guide
Ask me questions while you tour the home.