Estimated Value: $226,852 - $268,000
4
Beds
1
Bath
1,728
Sq Ft
$143/Sq Ft
Est. Value
About This Home
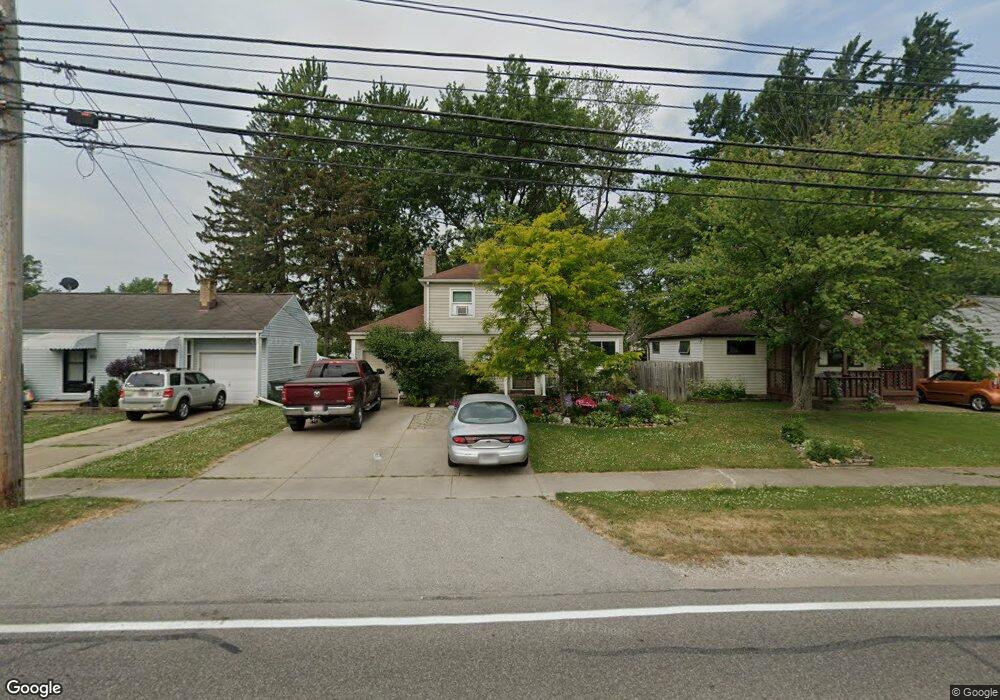
This home is located at 105 Eastland Rd, Berea, OH 44017 and is currently estimated at $246,963, approximately $142 per square foot. 105 Eastland Rd is a home located in Cuyahoga County with nearby schools including Grindstone Elementary School, Berea-Midpark Middle School, and Berea-Midpark High School.
Ownership History
Date
Name
Owned For
Owner Type
Purchase Details
Closed on
Jan 25, 2024
Sold by
Martin Dale J and Martin Betty A
Bought by
Martin Family Fortress Trust and Martin
Current Estimated Value
Purchase Details
Closed on
Feb 6, 2009
Sold by
Martin Betty A and Martin Dale J
Bought by
Martin Betty A and Martin Dale J
Home Financials for this Owner
Home Financials are based on the most recent Mortgage that was taken out on this home.
Original Mortgage
$72,000
Interest Rate
4.79%
Mortgage Type
New Conventional
Purchase Details
Closed on
Feb 20, 1999
Sold by
Ruffing Thomas E
Bought by
Ruffing Betty A
Purchase Details
Closed on
May 1, 1987
Sold by
Starzynski David R
Bought by
Ruffing Thomas E
Purchase Details
Closed on
Aug 19, 1983
Sold by
Starzynski David R
Bought by
Starzynski David R
Purchase Details
Closed on
Oct 30, 1978
Sold by
Kowalewski Eugene K
Bought by
Starzynski David R
Purchase Details
Closed on
Jan 1, 1975
Bought by
Kowalewski Eugene K
Create a Home Valuation Report for This Property
The Home Valuation Report is an in-depth analysis detailing your home's value as well as a comparison with similar homes in the area
Home Values in the Area
Average Home Value in this Area
Purchase History
| Date | Buyer | Sale Price | Title Company |
|---|---|---|---|
| Martin Family Fortress Trust | -- | Cuyahoga Title Services | |
| Martin Betty A | -- | Old Republic Title | |
| Ruffing Betty A | -- | -- | |
| Ruffing Thomas E | $57,900 | -- | |
| Starzynski David R | -- | -- | |
| Starzynski David R | $44,000 | -- | |
| Kowalewski Eugene K | -- | -- |
Source: Public Records
Mortgage History
| Date | Status | Borrower | Loan Amount |
|---|---|---|---|
| Previous Owner | Martin Betty A | $72,000 |
Source: Public Records
Tax History Compared to Growth
Tax History
| Year | Tax Paid | Tax Assessment Tax Assessment Total Assessment is a certain percentage of the fair market value that is determined by local assessors to be the total taxable value of land and additions on the property. | Land | Improvement |
|---|---|---|---|---|
| 2024 | $4,136 | $71,505 | $9,625 | $61,880 |
| 2023 | $3,679 | $53,270 | $9,030 | $44,240 |
| 2022 | $3,656 | $53,270 | $9,030 | $44,240 |
| 2021 | $3,625 | $53,270 | $9,030 | $44,240 |
| 2020 | $3,464 | $45,150 | $7,670 | $37,490 |
| 2019 | $3,372 | $129,000 | $21,900 | $107,100 |
| 2018 | $3,353 | $45,150 | $7,670 | $37,490 |
| 2017 | $3,302 | $41,270 | $6,970 | $34,300 |
| 2016 | $3,278 | $41,270 | $6,970 | $34,300 |
| 2015 | $3,226 | $41,270 | $6,970 | $34,300 |
| 2014 | $3,226 | $42,990 | $7,250 | $35,740 |
Source: Public Records
Map
Nearby Homes
- 159 Eastland Rd
- 147 Adams St
- 19419 Fowles Rd
- 41 Riverside Dr
- 0 E Bagley Rd Unit 5111166
- 47 Prospect St
- 190 Lee Rd
- 325 Robin Dr
- 202 4th Ave
- 135 W Bagley Rd
- 7400 Engle Rd
- 23 Hamilton St
- 7344 Engle Rd
- 74 Aaron St
- 217 Kraft St
- 43 Zeller Ct
- 8080 Oxford Dr
- 214 Race St
- 272 Pineview Dr
- 18676 N Winding Oak Dr