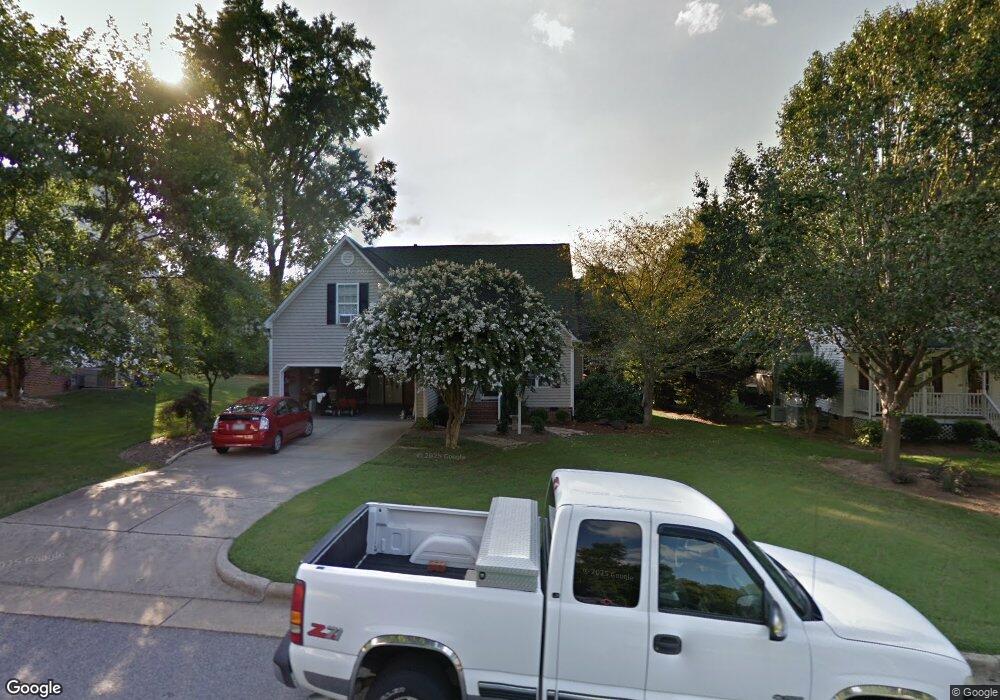
105 Farr Ct Garner, NC 27529
Estimated Value: $440,000 - $534,000
4
Beds
3
Baths
2,230
Sq Ft
$208/Sq Ft
Est. Value
About This Home
This home is located at 105 Farr Ct, Garner, NC 27529 and is currently estimated at $464,202, approximately $208 per square foot. 105 Farr Ct is a home located in Wake County with nearby schools including Timber Drive Elementary, North Garner Middle, and Garner High.
Ownership History
Date
Name
Owned For
Owner Type
Purchase Details
Closed on
Mar 28, 2022
Sold by
Allen James Michael and Allen Margaret
Bought by
James Michael Allen and Gordy Margaret
Current Estimated Value
Home Financials for this Owner
Home Financials are based on the most recent Mortgage that was taken out on this home.
Original Mortgage
$185,000
Outstanding Balance
$162,090
Interest Rate
3.63%
Mortgage Type
VA
Estimated Equity
$302,112
Purchase Details
Closed on
May 9, 2013
Sold by
Bradford Randall and Bradford Laura
Bought by
James Michael Allen
Home Financials for this Owner
Home Financials are based on the most recent Mortgage that was taken out on this home.
Original Mortgage
$197,900
Interest Rate
3.59%
Mortgage Type
VA
Purchase Details
Closed on
Mar 31, 2000
Sold by
Allen Thornton Homes Inc
Bought by
Bradford Randall and Bradford Laura
Home Financials for this Owner
Home Financials are based on the most recent Mortgage that was taken out on this home.
Original Mortgage
$133,920
Interest Rate
7.5%
Create a Home Valuation Report for This Property
The Home Valuation Report is an in-depth analysis detailing your home's value as well as a comparison with similar homes in the area
Home Values in the Area
Average Home Value in this Area
Purchase History
| Date | Buyer | Sale Price | Title Company |
|---|---|---|---|
| James Michael Allen | -- | Stewart Title Company | |
| James Michael Allen | -- | Stewart Title Company | |
| James Michael Allen | $198,000 | None Available | |
| Bradford Randall | $168,000 | -- |
Source: Public Records
Mortgage History
| Date | Status | Borrower | Loan Amount |
|---|---|---|---|
| Open | James Michael Allen | $185,000 | |
| Closed | James Michael Allen | $185,000 | |
| Previous Owner | James Michael Allen | $197,900 | |
| Previous Owner | Bradford Randall | $133,920 | |
| Closed | Bradford Randall | $25,110 |
Source: Public Records
Tax History Compared to Growth
Tax History
| Year | Tax Paid | Tax Assessment Tax Assessment Total Assessment is a certain percentage of the fair market value that is determined by local assessors to be the total taxable value of land and additions on the property. | Land | Improvement |
|---|---|---|---|---|
| 2025 | $4,579 | $439,621 | $110,000 | $329,621 |
| 2024 | $4,563 | $439,621 | $110,000 | $329,621 |
| 2023 | $3,427 | $265,342 | $55,000 | $210,342 |
| 2022 | $3,129 | $265,342 | $55,000 | $210,342 |
| 2021 | $2,971 | $265,342 | $55,000 | $210,342 |
| 2020 | $2,931 | $265,342 | $55,000 | $210,342 |
| 2019 | $2,672 | $207,081 | $38,000 | $169,081 |
| 2018 | $2,478 | $207,081 | $38,000 | $169,081 |
| 2017 | $2,396 | $207,081 | $38,000 | $169,081 |
| 2016 | $2,366 | $207,081 | $38,000 | $169,081 |
| 2015 | $2,384 | $208,802 | $40,000 | $168,802 |
| 2014 | -- | $208,802 | $40,000 | $168,802 |
Source: Public Records
Map
Nearby Homes
- 107 Binford Ct
- 220 Grand Pointe Dr
- 428 Grand Pointe Dr Unit 803
- 1607 Sycamore Dr
- 1508 N Gleneagle Dr
- 725 Thompson Rd
- 113 Heatherwood Dr
- 1308 Claymore Dr
- 715 Thompson Rd
- 721 Thompson Rd
- 107 Coachman Dr
- 1326 Vandora Springs Rd
- 1320 Pineview Dr
- 1101 Park Ave
- 132 Carriage House Trail
- 102 Castill Place
- 106 Argyle Ct
- 109 Hiddenwood Ct
- 704 Topleaf Ct
- 106 Teak Cir