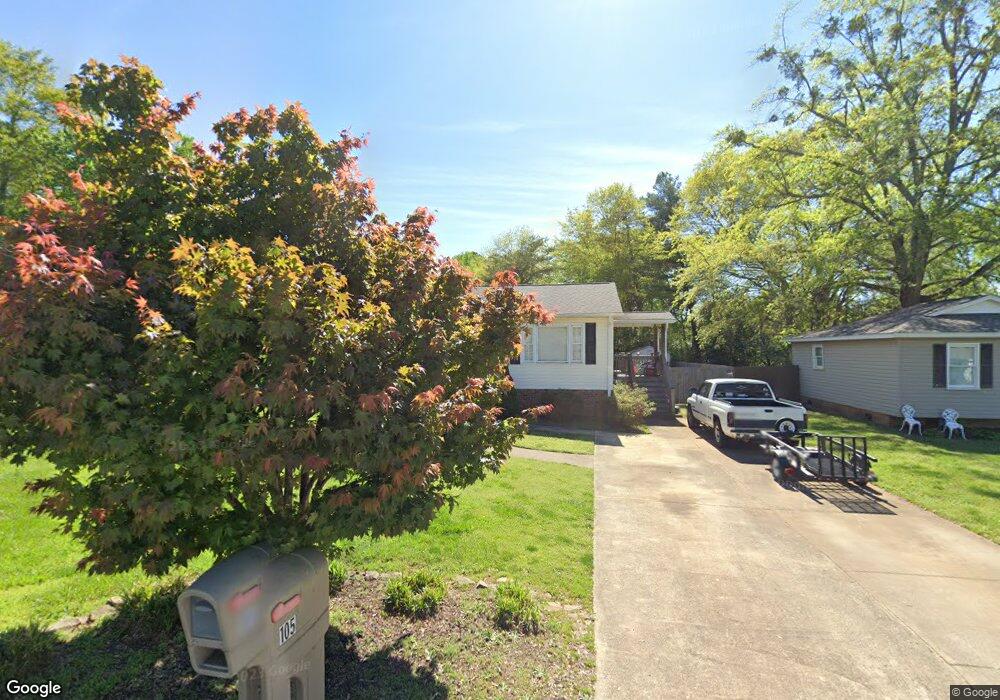
105 Fernleaf Dr Travelers Rest, SC 29690
Estimated Value: $224,000 - $267,265
4
Beds
3
Baths
1,880
Sq Ft
$130/Sq Ft
Est. Value
About This Home
This home is located at 105 Fernleaf Dr, Travelers Rest, SC 29690 and is currently estimated at $243,816, approximately $129 per square foot. 105 Fernleaf Dr is a home located in Greenville County with nearby schools including Heritage Elementary School, Northwest Middle School, and Travelers Rest High School.
Ownership History
Date
Name
Owned For
Owner Type
Purchase Details
Closed on
Oct 31, 2018
Sold by
Barrett Rodney Scott and Barrett Angela V
Bought by
Barrett Grady Lamar and Barrett Nancy P
Current Estimated Value
Purchase Details
Closed on
Oct 11, 2006
Sold by
Jpmorgan Chase Bank
Bought by
Barret Rodney Scott and Barrett Angela W
Purchase Details
Closed on
Jun 13, 2006
Sold by
Jones Darrin G
Bought by
Jpmorgan Chase Bank
Purchase Details
Closed on
Oct 13, 2004
Sold by
Palmetto Homes Of Greenville L
Bought by
Jones Darrin Glenn
Purchase Details
Closed on
Sep 14, 2004
Sold by
Knight Scott
Bought by
Palmetto Homes Of Greenville L
Purchase Details
Closed on
Sep 1, 2004
Sold by
Federal Home Loan Mortgage Corporation
Bought by
Knight Scott
Purchase Details
Closed on
Aug 17, 2004
Sold by
Brown Michael L
Bought by
Federal Home Loan Mortgage Corporation
Purchase Details
Closed on
Apr 30, 1999
Sold by
Hickman Brian D
Bought by
Brown Michael L
Create a Home Valuation Report for This Property
The Home Valuation Report is an in-depth analysis detailing your home's value as well as a comparison with similar homes in the area
Home Values in the Area
Average Home Value in this Area
Purchase History
| Date | Buyer | Sale Price | Title Company |
|---|---|---|---|
| Barrett Grady Lamar | $115,000 | None Available | |
| Barret Rodney Scott | $66,000 | None Available | |
| Jpmorgan Chase Bank | $68,000 | None Available | |
| Jones Darrin Glenn | $89,000 | -- | |
| Palmetto Homes Of Greenville L | -- | -- | |
| Knight Scott | $62,000 | -- | |
| Federal Home Loan Mortgage Corporation | $40,000 | -- | |
| Brown Michael L | $79,500 | -- |
Source: Public Records
Tax History Compared to Growth
Tax History
| Year | Tax Paid | Tax Assessment Tax Assessment Total Assessment is a certain percentage of the fair market value that is determined by local assessors to be the total taxable value of land and additions on the property. | Land | Improvement |
|---|---|---|---|---|
| 2024 | $638 | $5,470 | $800 | $4,670 |
| 2023 | $561 | $5,470 | $800 | $4,670 |
| 2022 | $545 | $5,470 | $800 | $4,670 |
| 2021 | $536 | $5,470 | $800 | $4,670 |
| 2020 | $475 | $4,840 | $600 | $4,240 |
| 2019 | $472 | $4,840 | $600 | $4,240 |
| 2018 | $604 | $3,180 | $600 | $2,580 |
| 2017 | $600 | $3,180 | $600 | $2,580 |
| 2016 | $567 | $79,590 | $15,000 | $64,590 |
| 2015 | $1,460 | $79,590 | $15,000 | $64,590 |
| 2014 | $1,521 | $83,990 | $13,866 | $70,124 |
Source: Public Records
Map
Nearby Homes
- 7 Bubbling Creek Dr
- 611 Bridwell Rd
- Edgefield Plan at Spring Park
- 213 Mccormick Place Unit SP 18 Edgefield D
- 213 Mccormick Place
- 217 Mccormick Place Unit SP 20 Edgefield C
- 217 Mccormick Place
- 219 Mccormick Place Unit SP 21 Edgefield B
- 505 Tolar Rd
- 510 Waveland Dr Unit SP 42 Edgefield D
- 206 Mccormick Place Unit SP 27 Edgefield A
- 4 Glenview Park Place
- 5 Tolar Rd
- 238 Barred Owl Rd
- 19 Halowell Ln
- 230 Barred Owl Rd
- 224 Barred Owl Rd
- 212 Barred Owl Rd
- 321 Barred Owl Rd
- 208 Barred Owl Rd