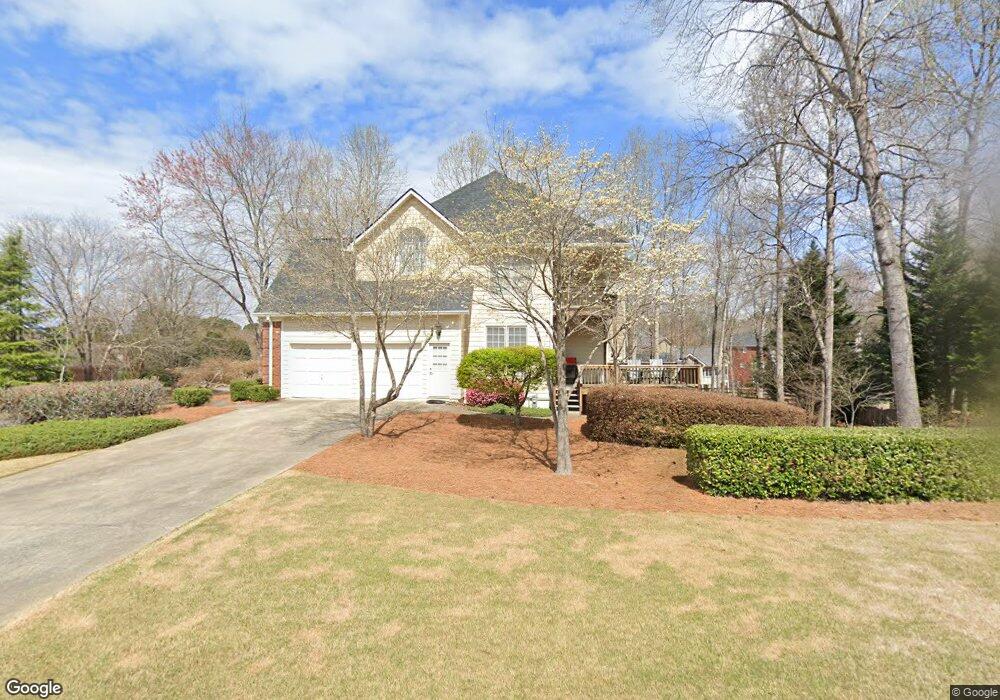
105 Fieldgate Ct Unit 2B Roswell, GA 30075
Union Hill NeighborhoodEstimated Value: $677,000 - $700,594
4
Beds
4
Baths
3,057
Sq Ft
$225/Sq Ft
Est. Value
About This Home
This home is located at 105 Fieldgate Ct Unit 2B, Roswell, GA 30075 and is currently estimated at $688,797, approximately $225 per square foot. 105 Fieldgate Ct Unit 2B is a home located in Cherokee County with nearby schools including Arnold Mill Elementary School, Mill Creek Middle School, and River Ridge High School.
Ownership History
Date
Name
Owned For
Owner Type
Purchase Details
Closed on
Sep 14, 2023
Sold by
Kerik Gerardo R
Bought by
Kerik Joint Revocable Trust Dated May 18 and Kerik Gerardo R
Current Estimated Value
Purchase Details
Closed on
Jun 20, 2002
Sold by
Bell Jefferson D and Bell Lisa T
Bought by
Drotleff Andrew J and Drotleff Tami L
Home Financials for this Owner
Home Financials are based on the most recent Mortgage that was taken out on this home.
Original Mortgage
$280,000
Interest Rate
6.67%
Mortgage Type
New Conventional
Purchase Details
Closed on
Jun 30, 1998
Sold by
Laucella David N and Laucella Nancy Lee
Bought by
Bell Jefferson D
Home Financials for this Owner
Home Financials are based on the most recent Mortgage that was taken out on this home.
Original Mortgage
$233,900
Interest Rate
7.12%
Mortgage Type
New Conventional
Purchase Details
Closed on
Nov 27, 1996
Sold by
2728 Holding Co
Bought by
Laucella David Nancy
Create a Home Valuation Report for This Property
The Home Valuation Report is an in-depth analysis detailing your home's value as well as a comparison with similar homes in the area
Home Values in the Area
Average Home Value in this Area
Purchase History
| Date | Buyer | Sale Price | Title Company |
|---|---|---|---|
| Kerik Joint Revocable Trust Dated May 18 | -- | -- | |
| Drotleff Andrew J | $350,000 | -- | |
| Bell Jefferson D | $259,900 | -- | |
| Laucella David Nancy | $247,900 | -- |
Source: Public Records
Mortgage History
| Date | Status | Borrower | Loan Amount |
|---|---|---|---|
| Previous Owner | Drotleff Andrew J | $280,000 | |
| Previous Owner | Bell Jefferson D | $233,900 | |
| Closed | Laucella David Nancy | $0 |
Source: Public Records
Tax History Compared to Growth
Tax History
| Year | Tax Paid | Tax Assessment Tax Assessment Total Assessment is a certain percentage of the fair market value that is determined by local assessors to be the total taxable value of land and additions on the property. | Land | Improvement |
|---|---|---|---|---|
| 2025 | $1,553 | $261,568 | $54,800 | $206,768 |
| 2024 | $6,064 | $255,896 | $52,000 | $203,896 |
| 2023 | $5,074 | $229,544 | $50,000 | $179,544 |
| 2022 | $5,277 | $215,592 | $44,000 | $171,592 |
| 2021 | $4,676 | $170,920 | $36,000 | $134,920 |
| 2020 | $4,207 | $150,520 | $36,000 | $114,520 |
| 2019 | $4,136 | $147,760 | $36,000 | $111,760 |
| 2018 | $4,201 | $149,240 | $36,000 | $113,240 |
| 2017 | $3,997 | $352,500 | $29,600 | $111,400 |
| 2016 | $4,080 | $356,100 | $29,600 | $112,840 |
| 2015 | $3,759 | $325,400 | $25,600 | $104,560 |
| 2014 | $3,479 | $301,000 | $25,600 | $94,800 |
Source: Public Records
Map
Nearby Homes
- 740 Dunscore Ct
- 14210 Old Course Dr
- Lot 1 Cox Rd
- LOT 4 Cox Rd
- LOT 3 Cox Rd
- LOT 2 Cox Rd
- 212 Fernwood Place
- Magnolia Plan at Magnolia Reserve
- Chatham Plan at Magnolia Reserve
- Turnberry Plan at Magnolia Reserve
- Heritage Plan at Magnolia Reserve
- 119 Chateau Place
- 120 Fernwood Dr
- 789 Cardinal Cove
- 103 Branch Dr
- 1005 Fieldgate Ln
- 115 Fieldgate Ct
- 1025 Fieldgate Ln
- 0 Fieldgate Ln Unit 7224748
- 0 Fieldgate Ln Unit 8563262
- 0 Fieldgate Ln Unit 8451578
- 0 Fieldgate Ln Unit 7454778
- 0 Fieldgate Ln
- 1935 Settindown Dr
- 1905 Settindown Dr Unit 1A
- 1010 Fieldgate Ln
- 125 Fieldgate Ct Unit 2B
- 110 Fieldgate Ct
- 1020 Fieldgate Ln Unit 2B
- 0 Fieldgate Ct Unit 3133595
- 0 Fieldgate Ct
- 1945 Settindown Dr
- 135 Fieldgate Ct
- 1035 Fieldgate Ln
- 1895 Settindown Dr Unit 1AQ