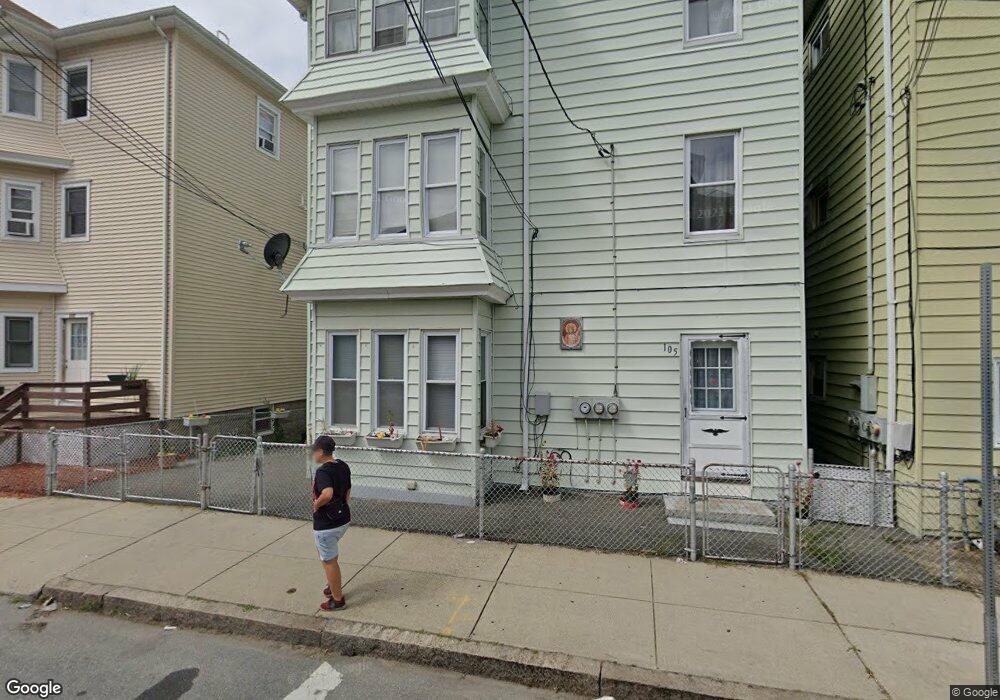
105 Flint St Fall River, MA 02723
Flint NeighborhoodEstimated Value: $428,198 - $648,000
6
Beds
3
Baths
3,521
Sq Ft
$158/Sq Ft
Est. Value
About This Home
This home is located at 105 Flint St, Fall River, MA 02723 and is currently estimated at $556,300, approximately $157 per square foot. 105 Flint St is a home located in Bristol County with nearby schools including Mary Fonseca Elementary School, Talbot Innovation School, and B M C Durfee High School.
Ownership History
Date
Name
Owned For
Owner Type
Purchase Details
Closed on
Jun 18, 1998
Sold by
Raposo Manuel and Raposo Ana M
Bought by
Reis Miguel A and Reis Ana I
Current Estimated Value
Home Financials for this Owner
Home Financials are based on the most recent Mortgage that was taken out on this home.
Original Mortgage
$60,000
Outstanding Balance
$12,045
Interest Rate
7.09%
Mortgage Type
Purchase Money Mortgage
Estimated Equity
$544,255
Create a Home Valuation Report for This Property
The Home Valuation Report is an in-depth analysis detailing your home's value as well as a comparison with similar homes in the area
Home Values in the Area
Average Home Value in this Area
Purchase History
| Date | Buyer | Sale Price | Title Company |
|---|---|---|---|
| Reis Miguel A | $100,000 | -- |
Source: Public Records
Mortgage History
| Date | Status | Borrower | Loan Amount |
|---|---|---|---|
| Open | Reis Miguel A | $60,000 |
Source: Public Records
Tax History
| Year | Tax Paid | Tax Assessment Tax Assessment Total Assessment is a certain percentage of the fair market value that is determined by local assessors to be the total taxable value of land and additions on the property. | Land | Improvement |
|---|---|---|---|---|
| 2025 | $5,360 | $468,100 | $100,600 | $367,500 |
| 2024 | $5,095 | $443,400 | $94,000 | $349,400 |
| 2023 | $4,508 | $367,400 | $78,800 | $288,600 |
| 2022 | $3,998 | $316,800 | $75,100 | $241,700 |
| 2021 | $3,648 | $263,800 | $71,800 | $192,000 |
| 2020 | $3,264 | $225,900 | $69,500 | $156,400 |
| 2019 | $2,823 | $193,600 | $69,500 | $124,100 |
| 2018 | $2,702 | $184,800 | $73,600 | $111,200 |
| 2017 | $2,587 | $184,800 | $73,600 | $111,200 |
| 2016 | $2,704 | $198,400 | $90,100 | $108,300 |
| 2015 | $2,549 | $194,900 | $86,600 | $108,300 |
| 2014 | $2,705 | $215,000 | $96,200 | $118,800 |
Source: Public Records
Map
Nearby Homes
- 88 Harrison St Unit 5
- 1244 Pleasant St
- 70 Jencks St
- 1155-1157 Pleasant St
- 178 Thomas St
- 129 County St
- 25 Lebanon St Unit D
- 25 Lebanon St Unit C
- 152 Alden St
- 150 Downing St
- 165 Eastern Ave
- 847 Pleasant St
- 10 Carlisa Dr
- 580 County St
- 529 Eastern Ave
- 139 Quarry St
- 84 Healy St
- 31 Choate St
- 869 Bedford St
- 144 Choate St
- 117 Flint St
- 101 Flint St
- 95 Flint St
- 98 Harrison St
- 123 Flint St
- 83 Flint St
- 128 Harrison St
- 76 Harrison St
- 88 Harsison Unit 1
- 88 Harrison St Unit 4
- 88 Harrison St Unit 3
- 88 Harrison St Unit 2
- 88 Harrison St Unit 1
- 137 Flint St
- 132 Harrison St
- 75 Flint St
- 86 Flint St
- 141 Flint St
- 74 Harrison St
- 65 Flint St
Your Personal Tour Guide
Ask me questions while you tour the home.