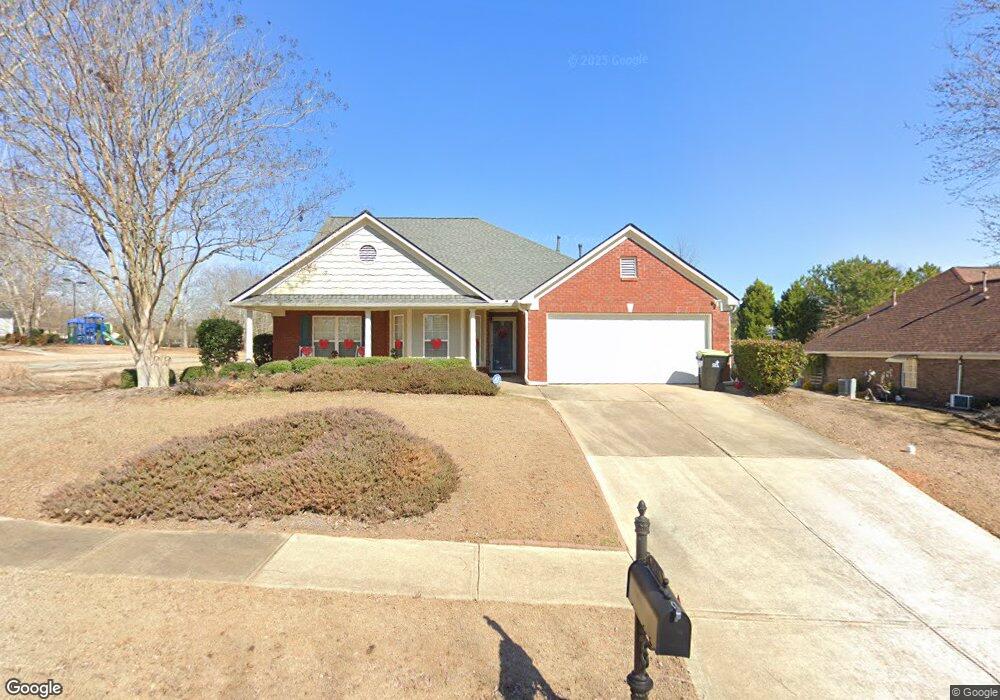
105 Garrison Ln Locust Grove, GA 30248
Estimated Value: $340,000 - $403,000
4
Beds
3
Baths
2,708
Sq Ft
$132/Sq Ft
Est. Value
About This Home
This home is located at 105 Garrison Ln, Locust Grove, GA 30248 and is currently estimated at $357,573, approximately $132 per square foot. 105 Garrison Ln is a home located in Henry County with nearby schools including Bethlehem Elementary School, Luella Middle School, and Luella High School.
Ownership History
Date
Name
Owned For
Owner Type
Purchase Details
Closed on
Jun 3, 2010
Sold by
Federal Natl Mtg Assn Fnma
Bought by
Lowry Rodney H
Current Estimated Value
Home Financials for this Owner
Home Financials are based on the most recent Mortgage that was taken out on this home.
Original Mortgage
$117,418
Outstanding Balance
$77,535
Interest Rate
4.75%
Mortgage Type
FHA
Estimated Equity
$280,038
Purchase Details
Closed on
Aug 4, 2009
Sold by
Brantley Jerri A and Brantley Vince F
Bought by
Chase Hm Fin Llc
Purchase Details
Closed on
Jun 15, 2004
Sold by
Parkview South Builders Inc
Bought by
Brantley Jerri A and Brantley Vince
Home Financials for this Owner
Home Financials are based on the most recent Mortgage that was taken out on this home.
Original Mortgage
$189,900
Interest Rate
6.25%
Mortgage Type
New Conventional
Create a Home Valuation Report for This Property
The Home Valuation Report is an in-depth analysis detailing your home's value as well as a comparison with similar homes in the area
Home Values in the Area
Average Home Value in this Area
Purchase History
| Date | Buyer | Sale Price | Title Company |
|---|---|---|---|
| Lowry Rodney H | -- | -- | |
| Chase Hm Fin Llc | $199,035 | -- | |
| Federal National Mortgage Association | -- | -- | |
| Chase Home Finance Llc | $199,035 | -- | |
| Brantley Jerri A | $189,900 | -- |
Source: Public Records
Mortgage History
| Date | Status | Borrower | Loan Amount |
|---|---|---|---|
| Open | Lowry Rodney H | $117,418 | |
| Previous Owner | Brantley Jerri A | $189,900 |
Source: Public Records
Tax History Compared to Growth
Tax History
| Year | Tax Paid | Tax Assessment Tax Assessment Total Assessment is a certain percentage of the fair market value that is determined by local assessors to be the total taxable value of land and additions on the property. | Land | Improvement |
|---|---|---|---|---|
| 2025 | $5,929 | $148,960 | $16,000 | $132,960 |
| 2024 | $5,929 | $138,080 | $16,000 | $122,080 |
| 2023 | $5,320 | $137,640 | $14,800 | $122,840 |
| 2022 | $4,562 | $117,880 | $14,800 | $103,080 |
| 2021 | $3,406 | $87,760 | $14,800 | $72,960 |
| 2020 | $3,225 | $83,040 | $10,000 | $73,040 |
| 2019 | $2,891 | $74,320 | $10,000 | $64,320 |
| 2018 | $2,681 | $68,840 | $8,000 | $60,840 |
| 2016 | $2,526 | $64,800 | $8,000 | $56,800 |
| 2015 | $2,427 | $60,360 | $8,000 | $52,360 |
| 2014 | $2,456 | $60,360 | $8,000 | $52,360 |
Source: Public Records
Map
Nearby Homes
- 512 Vickers Ln
- 412 Eglington Trail
- 640 Howell Dr
- 1220 Nottley Dr
- 112 Leveret Rd
- 1360 Luella Rd
- 633 Jervis Way
- 115 N Chesapeake Bay Dr
- 1429 Kentmire Ct
- 2336 Mcintosh Dr
- 1171 Bodega Loop
- 2356 Mcintosh Dr
- 1913 Avondale Ct
- 119 Bantry Way
- 1729 Cadence St
- 2439 Mcintosh Dr
- 271 Trestle Rd
- 214 Georgian Way
- 3157 Highway 155
- 436 Lothbury Ave
- 109 Garrison Ln
- 300 Randall Ct
- 113 Garrison Ln
- 304 Randall Ct
- 304 Randall Ct
- 104 Garrison Ln
- 308 Randall Ct
- 108 Garrison Ln
- 117 Garrison Ln
- 117 Garrison Ln Unit 1
- 211 Gilliam Ct Unit 1
- 211 Gilliam Ct
- 112 Garrison Ln
- 312 Randall Ct
- 116 Garrison Ln
- 121 Garrison Ln
- 215 Gilliam Ct
- 301 Randall Ct
- 409 Mazley Dr
- 316 Randall Ct