105 Glenbrook Ct Lake Worth, FL 33462
Estimated Value: $1,326,557 - $1,957,000
5
Beds
5
Baths
4,735
Sq Ft
$352/Sq Ft
Est. Value
About This Home
This home is located at 105 Glenbrook Ct, Lake Worth, FL 33462 and is currently estimated at $1,666,139, approximately $351 per square foot. 105 Glenbrook Ct is a home located in Palm Beach County with nearby schools including Starlight Cove Elementary School, Santaluces Community High School, and Tradewinds Middle School.
Ownership History
Date
Name
Owned For
Owner Type
Purchase Details
Closed on
Dec 19, 2014
Sold by
Rubino John G and Rubino Abigail Burns
Bought by
Rubino John G and 2011 John G Rubino Living Trust
Current Estimated Value
Purchase Details
Closed on
May 23, 2011
Sold by
Rubino John G and Rubino Dolores E
Bought by
Rubino John G and Aldous Shawn
Purchase Details
Closed on
Apr 8, 2002
Sold by
Ballman Fred C and Ballman Hazel I
Bought by
Rubino John G and Rubino Dolores E
Home Financials for this Owner
Home Financials are based on the most recent Mortgage that was taken out on this home.
Original Mortgage
$300,000
Outstanding Balance
$114,916
Interest Rate
5.75%
Estimated Equity
$1,551,223
Purchase Details
Closed on
Sep 23, 1998
Sold by
Hunt Robert W and Hunt Lola C
Bought by
Ballman Fred C and Ballman Hazel I
Purchase Details
Closed on
Oct 24, 1994
Sold by
Hunt Robert W
Bought by
Hunt Robert W and Hunt Lola C
Create a Home Valuation Report for This Property
The Home Valuation Report is an in-depth analysis detailing your home's value as well as a comparison with similar homes in the area
Home Values in the Area
Average Home Value in this Area
Purchase History
| Date | Buyer | Sale Price | Title Company |
|---|---|---|---|
| Rubino John G | -- | Attorney | |
| Rubino John G | -- | Attorney | |
| Rubino John G | $650,000 | Standard Title Ins Agency In | |
| Ballman Fred C | $600,000 | -- | |
| Hunt Robert W | -- | -- |
Source: Public Records
Mortgage History
| Date | Status | Borrower | Loan Amount |
|---|---|---|---|
| Open | Rubino John G | $300,000 |
Source: Public Records
Tax History Compared to Growth
Tax History
| Year | Tax Paid | Tax Assessment Tax Assessment Total Assessment is a certain percentage of the fair market value that is determined by local assessors to be the total taxable value of land and additions on the property. | Land | Improvement |
|---|---|---|---|---|
| 2024 | $10,665 | $587,652 | -- | -- |
| 2023 | $10,632 | $570,536 | $0 | $0 |
| 2022 | $10,873 | $553,918 | $0 | $0 |
| 2021 | $10,858 | $537,784 | $0 | $0 |
| 2020 | $10,817 | $530,359 | $0 | $0 |
| 2019 | $10,716 | $518,435 | $0 | $0 |
| 2018 | $10,239 | $508,768 | $0 | $0 |
| 2017 | $10,144 | $498,304 | $0 | $0 |
| 2016 | $10,216 | $488,055 | $0 | $0 |
| 2015 | $10,416 | $484,662 | $0 | $0 |
| 2014 | $10,423 | $480,815 | $0 | $0 |
Source: Public Records
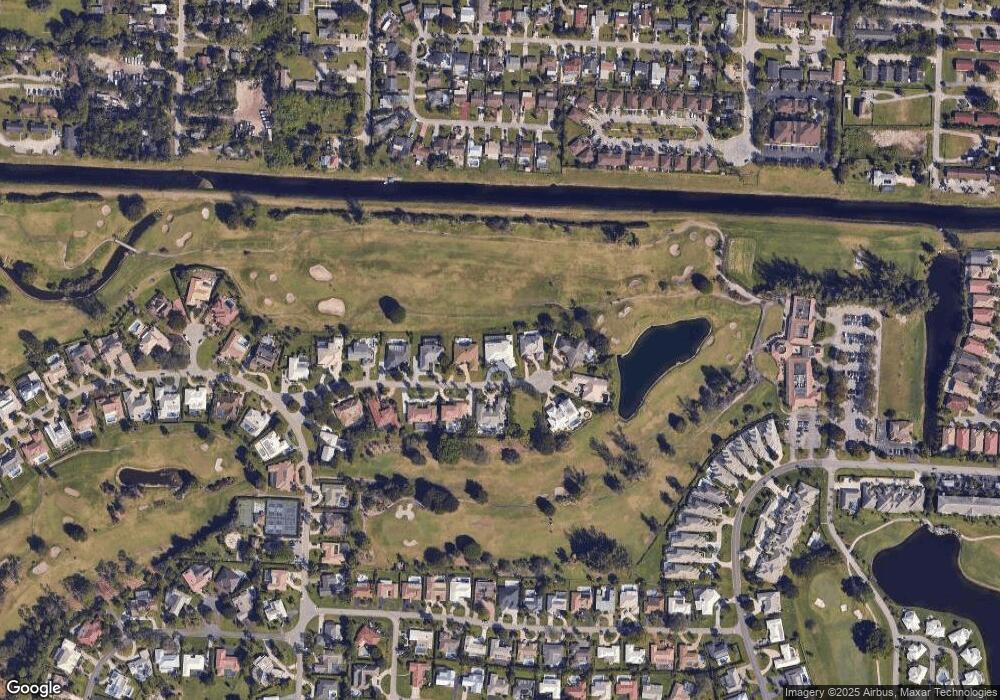
Map
Nearby Homes
- 100 Glenbrook Ct
- 200 Walton Heath Dr
- 3694 Brooklyn Ln
- 169 Atlantis Blvd Unit 206
- 248 Palm Cir
- 257 N Country Club Dr
- 145 Atlantis Blvd Unit 40
- 145 Atlantis Blvd Unit 2030
- 145 Atlantis Blvd Unit 1040
- 145 Atlantis 201 Blvd Unit 201
- 250 John F. Kennedy Dr Unit 1010
- 250 John F. Kennedy Dr Unit 3030
- 250 John F. Kennedy Dr Unit 2020
- 250 John F. Kennedy Dr Unit 1070
- 233 Rio Vista Cir
- 300 John F. Kennedy Dr Unit PH5
- 9 Atrium Cir Unit A
- 362 Yorktowne Cir
- 324 Orange Tree Dr Unit 50
- 437 N Country Club Dr
- 103 Glenbrook Ct
- 107 Glenbrook Ct
- 106 Glenbrook Ct
- 109 Glenbrook Ct
- 101 Glenbrook Ct
- 108 Glenbrook Ct
- 102 Glenbrook Ct
- 110 Glenbrook Ct
- 111 Glenbrook Ct
- 112 Glenbrook Ct
- 113 Glenbrook Ct
- 114 Glenbrook Ct
- 115 Glenbrook Ct
- 320 Glenbrook Dr
- 3751 Brooklyn Ln
- 3757 Brooklyn Ln
- 326 Glenbrook Dr
- 3763 Brooklyn Ln
- 3733 Brooklyn Ln
- 3727 Brooklyn Ln