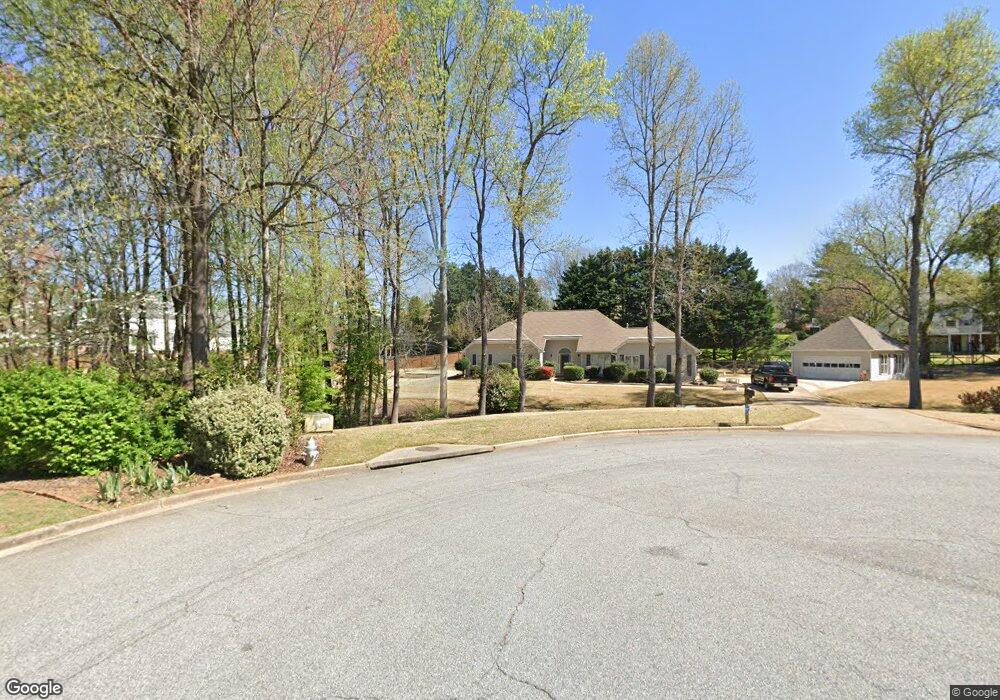
105 Glenclairn Ct Unit 7 Roswell, GA 30076
Saddle Creek NeighborhoodEstimated Value: $593,000 - $642,309
3
Beds
3
Baths
2,060
Sq Ft
$301/Sq Ft
Est. Value
About This Home
This home is located at 105 Glenclairn Ct Unit 7, Roswell, GA 30076 and is currently estimated at $619,577, approximately $300 per square foot. 105 Glenclairn Ct Unit 7 is a home located in Fulton County with nearby schools including Sweet Apple Elementary School, Elkins Pointe Middle School, and Milton High School.
Ownership History
Date
Name
Owned For
Owner Type
Purchase Details
Closed on
Dec 7, 2000
Sold by
Bauer Maria E
Bought by
Schroeder Moritz J
Current Estimated Value
Home Financials for this Owner
Home Financials are based on the most recent Mortgage that was taken out on this home.
Original Mortgage
$188,550
Outstanding Balance
$79,004
Interest Rate
7.81%
Mortgage Type
New Conventional
Estimated Equity
$540,573
Purchase Details
Closed on
May 29, 1998
Sold by
Farmer Jeffrey E and Farmer Maureen
Bought by
Bauer Maria E
Home Financials for this Owner
Home Financials are based on the most recent Mortgage that was taken out on this home.
Original Mortgage
$75,000
Interest Rate
7.21%
Mortgage Type
New Conventional
Purchase Details
Closed on
Feb 26, 1996
Sold by
Barrett David E Denise
Bought by
Farmer Jeffrey Maureen
Create a Home Valuation Report for This Property
The Home Valuation Report is an in-depth analysis detailing your home's value as well as a comparison with similar homes in the area
Home Values in the Area
Average Home Value in this Area
Purchase History
| Date | Buyer | Sale Price | Title Company |
|---|---|---|---|
| Schroeder Moritz J | $198,500 | -- | |
| Bauer Maria E | $171,500 | -- | |
| Farmer Jeffrey Maureen | $162,900 | -- |
Source: Public Records
Mortgage History
| Date | Status | Borrower | Loan Amount |
|---|---|---|---|
| Open | Schroeder Moritz J | $188,550 | |
| Previous Owner | Bauer Maria E | $75,000 | |
| Closed | Farmer Jeffrey Maureen | $0 |
Source: Public Records
Tax History Compared to Growth
Tax History
| Year | Tax Paid | Tax Assessment Tax Assessment Total Assessment is a certain percentage of the fair market value that is determined by local assessors to be the total taxable value of land and additions on the property. | Land | Improvement |
|---|---|---|---|---|
| 2025 | $755 | $191,120 | $76,400 | $114,720 |
| 2023 | $5,556 | $196,840 | $76,080 | $120,760 |
| 2022 | $3,044 | $173,600 | $52,080 | $121,520 |
| 2021 | $3,623 | $166,520 | $35,800 | $130,720 |
| 2020 | $3,678 | $164,560 | $35,400 | $129,160 |
| 2019 | $603 | $137,640 | $38,000 | $99,640 |
| 2018 | $3,245 | $134,400 | $37,080 | $97,320 |
| 2017 | $2,990 | $115,880 | $24,040 | $91,840 |
| 2016 | $2,974 | $115,880 | $24,040 | $91,840 |
| 2015 | $3,617 | $115,880 | $24,040 | $91,840 |
| 2014 | $2,834 | $105,200 | $21,840 | $83,360 |
Source: Public Records
Map
Nearby Homes
- 600 Rounsaville Rd
- 1115 Primrose Dr
- 565 Camber Woods Dr
- 530 Camber Woods Dr
- 300 Saddle Creek Ln
- 2230 Ashton Dr
- 4404 Orchard Trace
- 1040 Jordan Ln
- 290 Rucker Rd
- 640 Mae Ln
- 285 N Farm Dr
- 1110 Arya Dr
- 230 Bluff Oak Dr
- 406 Sweet Apple Cir
- 220 Hollyberry Dr
- 220 Hollyberry Ct
- 755 Anna Ln
- 12250 Broadwell Rd
- 225 Maison Ct
- 150 Saddle Lake Dr
- 115 Glenclairn Ct
- 140 Saddle Lake Dr
- 100 Glenclairn Ct
- 200 Saddle Lake Dr Unit 7
- 190 Saddle Lake Dr
- 190 Saddle Lake Dr Unit 7
- 170 Saddle Lake Dr Unit 7
- 100 Clenclairn Ct
- 540 Saddle Lake Dr
- 220 Saddle Lake Dr Unit 7
- 110 Glenclairn Ct Unit 7
- 125 Glenclairn Ct
- 125 Glenclairn Ct
- 230 Saddle Lake Dr
- 530 Saddle Lake Dr
- 530 Saddle Lake Dr Unit 7
- 120 Glenclairn Ct
- 250 Saddle Lake Dr
- 135 Glenclairn Ct