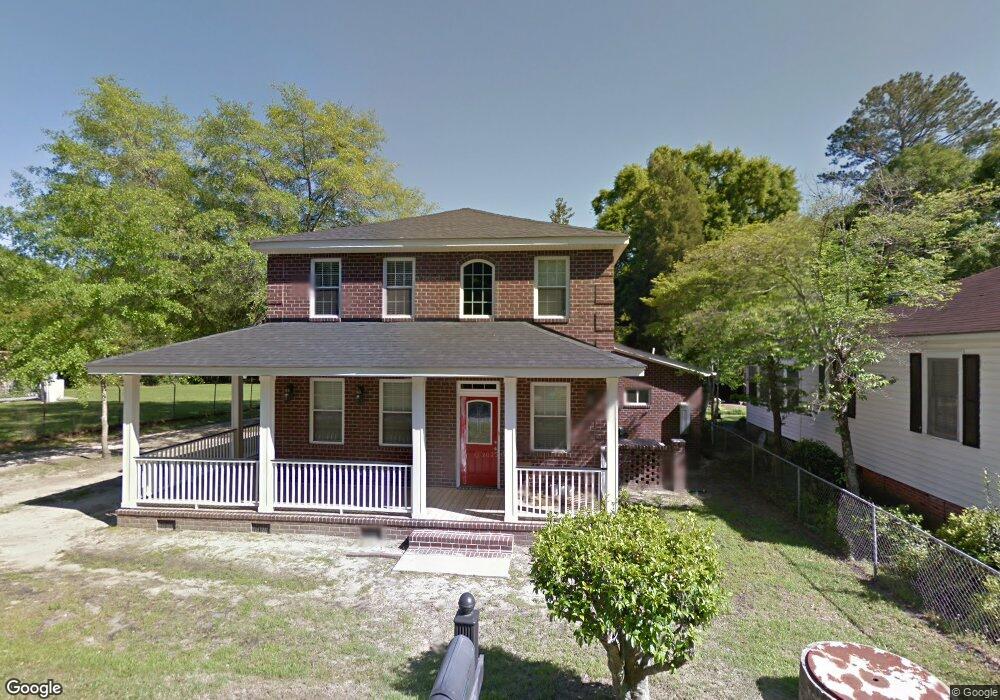
105 Graham Ln Summerville, SC 29483
Estimated Value: $694,792 - $842,000
3
Beds
3
Baths
2,942
Sq Ft
$265/Sq Ft
Est. Value
About This Home
This home is located at 105 Graham Ln, Summerville, SC 29483 and is currently estimated at $780,698, approximately $265 per square foot. 105 Graham Ln is a home with nearby schools including Summerville Elementary School, Alston Middle School, and Summerville High School.
Ownership History
Date
Name
Owned For
Owner Type
Purchase Details
Closed on
Feb 12, 2020
Sold by
Boller Ronald C and Boller Chana N
Bought by
Boller Ronald C and Boller Chana N
Current Estimated Value
Purchase Details
Closed on
Nov 8, 2018
Sold by
The Town Of Summerville
Bought by
Boller Ronald C and Boller Chana H
Purchase Details
Closed on
Jun 11, 2018
Sold by
Estate Of Frances Vivian White
Bought by
Boiler Ronald C and Boiler Chana N
Purchase Details
Closed on
Dec 25, 2010
Sold by
Boller Herman
Bought by
Boller Ronald C and Boller Chana H
Purchase Details
Closed on
Dec 20, 2010
Sold by
Frisby Charmaine
Bought by
Boller Ronald C and Boller Chana H
Purchase Details
Closed on
Dec 14, 2010
Sold by
Wilson Sam and Frisby Charmaine
Bought by
Boller Ronald and Boller Herman
Purchase Details
Closed on
Dec 10, 2010
Sold by
Boller Ronald
Bought by
Boller Ronald C and Boller Chana H
Create a Home Valuation Report for This Property
The Home Valuation Report is an in-depth analysis detailing your home's value as well as a comparison with similar homes in the area
Home Values in the Area
Average Home Value in this Area
Purchase History
| Date | Buyer | Sale Price | Title Company |
|---|---|---|---|
| Boller Ronald C | -- | None Available | |
| Boller Ronald C | -- | None Available | |
| Boiler Ronald C | $40,000 | None Available | |
| Boller Ronald C | -- | -- | |
| Boller Ronald C | -- | -- | |
| Boller Ronald | -- | -- | |
| Boller Ronald C | -- | -- |
Source: Public Records
Tax History Compared to Growth
Tax History
| Year | Tax Paid | Tax Assessment Tax Assessment Total Assessment is a certain percentage of the fair market value that is determined by local assessors to be the total taxable value of land and additions on the property. | Land | Improvement |
|---|---|---|---|---|
| 2025 | $3,942 | $23,935 | $9,095 | $14,840 |
| 2024 | $3,942 | $23,935 | $9,095 | $14,840 |
| 2023 | $3,942 | $15,632 | $4,244 | $11,388 |
| 2022 | $3,336 | $14,820 | $3,430 | $11,390 |
| 2021 | $3,386 | $14,820 | $3,430 | $11,390 |
| 2020 | $2,872 | $10,400 | $840 | $9,560 |
| 2019 | $2,799 | $10,400 | $840 | $9,560 |
| 2018 | $2,279 | $10,400 | $840 | $9,560 |
| 2017 | $2,232 | $10,400 | $840 | $9,560 |
| 2016 | $2,214 | $10,400 | $840 | $9,560 |
| 2015 | $2,218 | $10,400 | $840 | $9,560 |
| 2014 | $2,235 | $267,800 | $0 | $0 |
| 2013 | -- | $10,710 | $0 | $0 |
Source: Public Records
Map
Nearby Homes
- 113 Graham Ln
- 165 Grouper Ln
- 120 Sasportas Ln
- 114 E Carolina Ave
- 100 E Carolina Ave
- 137 White Pine Way
- 139 White Pine Way
- 117 White Pine Way
- 129 Sycamore Dr
- 111 Long Bow Rd
- 181 Pekoe Ct
- 1014 S Main St
- 114 Azalea Dr
- 191 Telfair Ct
- 204 Factors Walk
- 215 Marion Ave
- 501 Sunnyside Way
- 405 Sunnyside Way
- 403 Sunnyside Way
- 708 S Laurel St
- 109 Graham Ln
- 108 Graham Ln
- 104 Graham Ln
- 709 Felix St
- 112 Graham Ln
- 105 Sasportas Ln
- 107 Sasportas Ln
- 212 E Richland St
- 208 E Richland St
- 200 E Richland St
- 117 Graham Ln
- 111 Sasportas Ln
- 713 Felix St
- 119 Graham Ln
- 207 E Richland St
- 300 E Richland St
- 118 Graham Ln
- 0 E Richland St E
- 000 Richland St E
- 104 Sasportas Ln