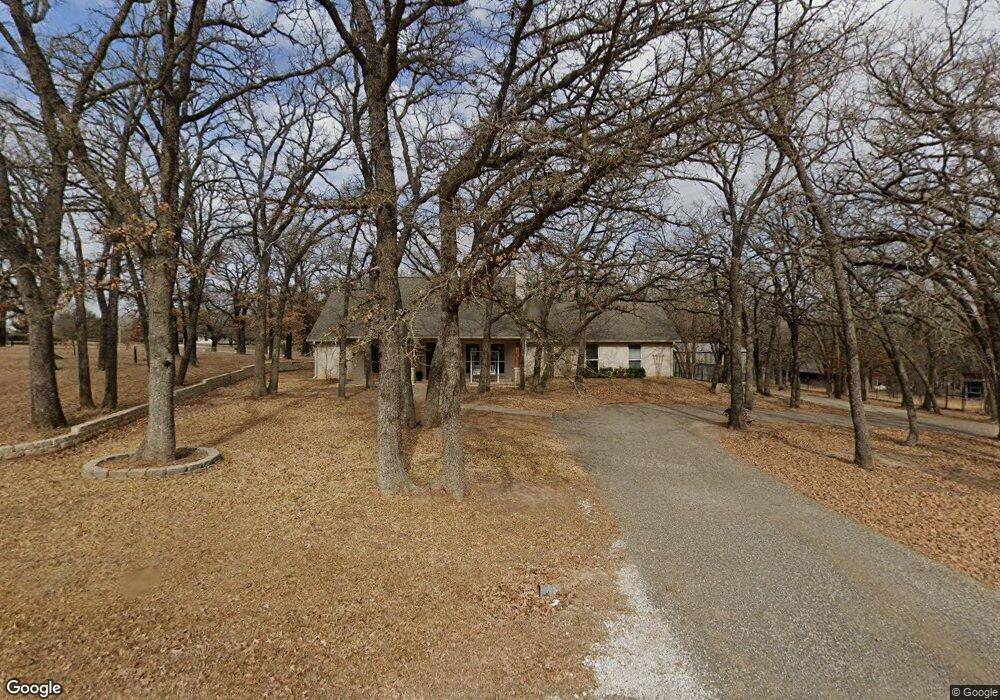
105 Greenwood Oaks Dr Weatherford, TX 76088
Estimated Value: $401,000 - $443,000
--
Bed
--
Bath
1,792
Sq Ft
$232/Sq Ft
Est. Value
About This Home
This home is located at 105 Greenwood Oaks Dr, Weatherford, TX 76088 and is currently estimated at $415,800, approximately $232 per square foot. 105 Greenwood Oaks Dr is a home located in Parker County with nearby schools including Wright Elementary School, Hall Middle School, and Weatherford High School.
Ownership History
Date
Name
Owned For
Owner Type
Purchase Details
Closed on
Jun 13, 2022
Sold by
Harold Schroeder Roy and Nagel Leesa
Bought by
Schroeder Leesa Nagel and Schroeder Warren Henry
Current Estimated Value
Purchase Details
Closed on
May 6, 2022
Sold by
Reynolds Jerald A and Reynolds Glenda
Bought by
Schroeder Roy H and Schroeder Leesa
Purchase Details
Closed on
Dec 13, 2012
Sold by
Reynolds Jerry and Reynolds Glenda
Bought by
Reynolds Jerald & Glenda Revocable
Purchase Details
Closed on
Oct 15, 1997
Bought by
Reynolds Jerald & Glenda Revocable
Purchase Details
Closed on
Jan 1, 1901
Bought by
Reynolds Jerald & Glenda Revocable
Create a Home Valuation Report for This Property
The Home Valuation Report is an in-depth analysis detailing your home's value as well as a comparison with similar homes in the area
Home Values in the Area
Average Home Value in this Area
Purchase History
| Date | Buyer | Sale Price | Title Company |
|---|---|---|---|
| Schroeder Leesa Nagel | -- | None Listed On Document | |
| Schroeder Roy H | -- | Providence Title Company | |
| Reynolds Jerald & Glenda Revocable | -- | -- | |
| The Jerald A Reynolds & Glenda J Reynold | -- | None Available | |
| Reynolds Jerald & Glenda Revocable | -- | -- | |
| Reynolds Jerald & Glenda Revocable | -- | -- |
Source: Public Records
Tax History Compared to Growth
Tax History
| Year | Tax Paid | Tax Assessment Tax Assessment Total Assessment is a certain percentage of the fair market value that is determined by local assessors to be the total taxable value of land and additions on the property. | Land | Improvement |
|---|---|---|---|---|
| 2025 | $5,526 | $418,732 | $75,000 | $343,732 |
| 2024 | $5,526 | $413,952 | $75,000 | $338,952 |
| 2023 | $5,526 | $426,880 | $75,000 | $351,880 |
| 2022 | $6,095 | $327,360 | $49,990 | $277,370 |
| 2021 | $6,132 | $346,140 | $49,990 | $296,150 |
| 2020 | $5,602 | $276,180 | $30,000 | $246,180 |
| 2019 | $5,746 | $276,180 | $30,000 | $246,180 |
| 2018 | $5,251 | $241,420 | $16,000 | $225,420 |
| 2017 | $4,894 | $241,420 | $16,000 | $225,420 |
| 2016 | $4,449 | $200,430 | $16,000 | $184,430 |
| 2015 | $3,202 | $200,430 | $16,000 | $184,430 |
| 2014 | $3,145 | $174,960 | $16,000 | $158,960 |
Source: Public Records
Map
Nearby Homes
- 100 Overton Ridge Cir
- 1035 Estancia Blvd
- 1027 Estancia Blvd
- 4009 Estancia Ct
- 2056 Vaquero Dr
- 119 Michael Ln
- 105 Michael Ln
- 3703 Greenwood Rd
- 2435 Old Mineral Wells Hwy
- 103 Saddle Club Rd
- 1930 Old Mineral Wells Hwy
- 119 Forest Creek Cir
- 209 Grace Ct
- 134 Forest Creek Cir
- 1882 Old Mineral Wells Hwy
- 1802 Greenwood Rd
- 142 Wood Oak Trail
- 121 Desperado Way
- 143 Desperado Way
- 124 Desperado Way
- 311 Greenwood Cut Off Rd
- 117 Greenwood Oaks Dr
- 104 Greenwood Oaks Dr
- 320 Greenwood Cut Off Rd
- 320 Greenwood Cut Off Rd
- 106 Country Oaks Ln
- 116 Greenwood Oaks Dr
- 125 Greenwood Oaks Dr
- 310 Greenwood Cut Off Rd
- 303 Greenwood Cut Off Rd
- 109 Country Oaks Ln
- 124 Greenwood Oaks Dr
- 112 Country Oaks Ln
- 302 Greenwood Cut Off Rd
- 551 Greenwood Cut Off Rd
- 128 Greenwood Oaks Dr
- 225 Greenwood Cut Off Rd
- 120 Country Oaks Ln
- 590 Greenwood Cut Off Rd
- 585 Greenwood Cut Off Rd